

In a strange turn of events, as financial markets of all types are collapsing due to growing fears over the spread of the coronavirus, Bitcoin, the Dow Jones Industrial Average, the S&P500 and gold, have all fallen to the same exact key mathematical level.
But why are these typically uncorrelated assets suddenly showing such commonality, and what is the significance behind the math that caused these assets to suddenly bounce?
Bitcoin, Gold, Dow Jones, and S&P500 All Fell to This Mathematical Level
Mathematics is the science behind and study of space, structure, quantity, and change. It’s been studied since the dawn of time and is among the most powerful laws governing everything around us.
Because it is ever-present, it’s often a tool traders and analysts turn to, to attempt to gain a competitive edge in financial markets like the stock market or cryptocurrencies.
Related Reading | Is the Coronavirus The Black Swan Event That Crushes Cryptocurrency?
Math may just be so powerful, that despite the unpredictable impact of the coronavirus – a potential black swan event – that it was able to predict just where the recent stock market collapse and the selloff in gold and cryptocurrencies would find support.
According to an article published this morning by Bloomberg, an 800-year-old mathematic principle born from Leonardo of Pisa during the 13th-century, perfectly predicted where the recent pullback in the S&P500 would end.
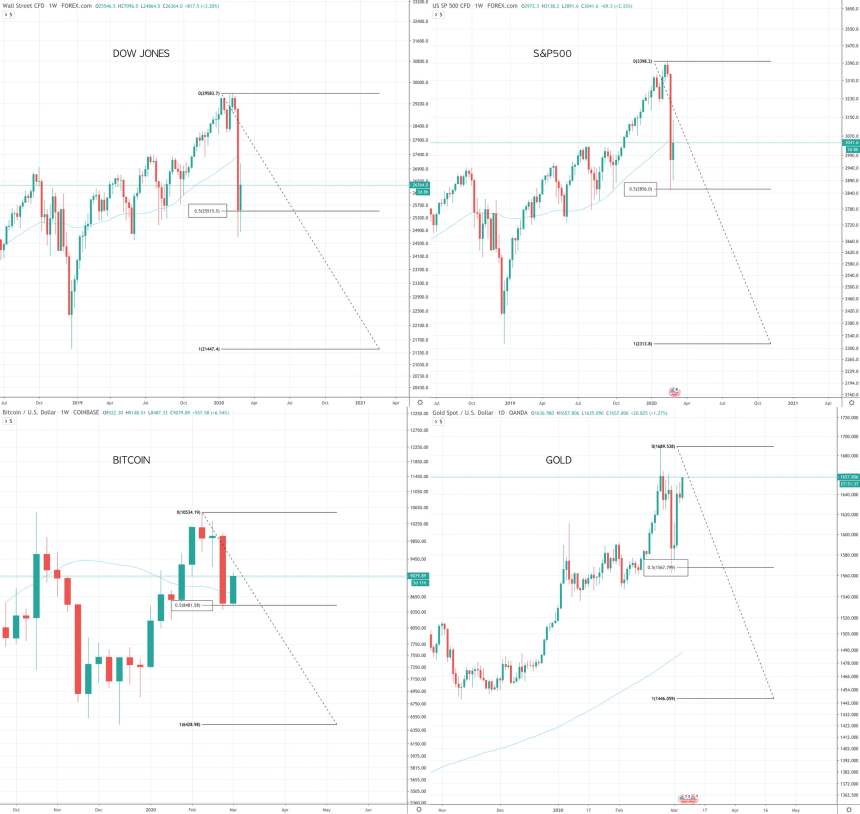
Oddly enough, the same level was respected and also held on price charts for Bitcoin, gold, and other stock market indexes like the Dow Jones Industrial Average.
Each of these assets retraced perfectly to the 50% level or the 0.5 Fibonacci level.

50% Trend Retracements Are the Most Profitable, According to Legendary Trader
Fibonacci numbers and their ratios are found everywhere in nature and regularly act as important levels for psychological support on financial asset price charts like Bitcoin, gold, the Dow, or the S&P500.
This same theory has been used by traders and analysts for generations with much success. Legendary trader W.D. Gann, during the early 1900s, discovered that the most profitable retracements to trade were the 50% level, and the level became a cornerstone in his analysis and teachings.
According to Gann theory, 50% psychologically is the “danger zone” for assets because it is where a full reversal can occur. But it also serves as the best possible place to reenter an “existing trend.”
Related Reading | Stock Market, Bitcoin, and Gold: Everything Is Collapsing Together
If the trend resumes, Gann explained that the asset would more than likely breach its previous high, and his teachings on the subject potentially were the first examples of “buying the dip” ever recorded.
Although markets have been in a downward spiral due to the coronavirus fears, investors are buying the dip at this critical level, and it could be their most profitable trade yet according to the math.