Starting from today, I will be doing a daily darkcoin (DRK) technical analysis, so it is better to set basic resistance and support levels that we can build upon throughout our analysis during the upcoming couple of weeks.
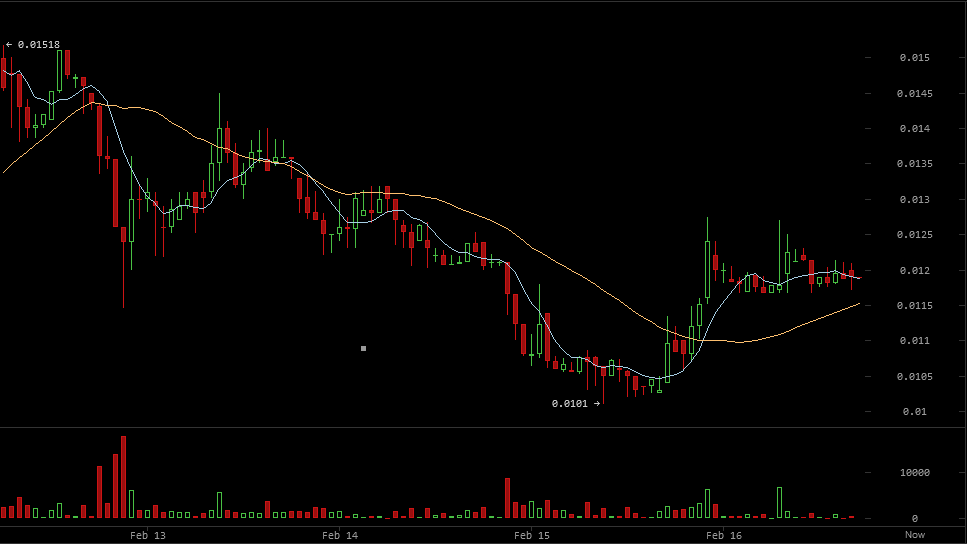
By examining the 1 hour Cryptsy (DRK/BTC) charts from tradingview.com (look at the below chart), we can notice that darkcoin price increased today from around 0.01021 BTC to 0.01275 BTC, before falling again to 0.01166 BTC. Since then, the price was oscillating between 0.01275 and 0.01166, as it seems that the 0.013 level is resisting a further rise in DRK price. As shown by the long upward shadows of the candlesticks on the 1 hourly chart, it is more likely to see darkcoin price decline to test the 0.01080 support level than see it increase during the upcoming 24 hours.
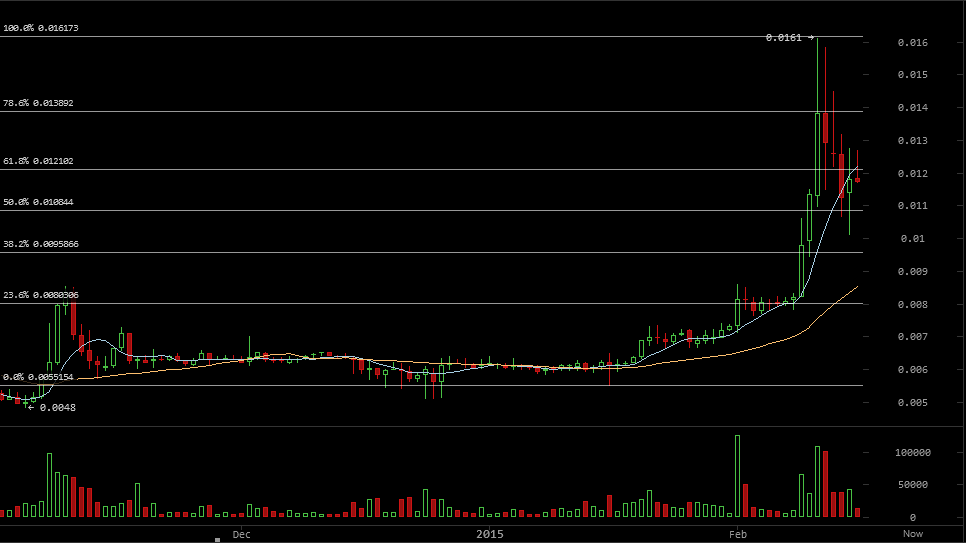
By studying the 1 day Cryptsy (DRK/BTC) chart from tradingview.com, drawing a trend line between the low reached on the 16th of January (0.005664) and the high reached on the 11th of February (0.01617) and plotting the Fibonacci retracements accordingly (look at the below chart), we can detect key resistance and support levels. The arrangement of the candlesticks on the 1 day chart shows that the price will mostly drop to test the 50% Fibonacci retracement level at 0.01084 BTC as shown by the long upward shadows of the candlesticks that correspond to the last 5 days.
Conclusion:
Darkcoin price rose to 0.01275 BTC, before falling again to 0.01166 BTC today. Our technical analysis points to the likelihood of a further drop to test the 0.01084 support level.
Charts from Cryptsy