Darkcoin price remained within the 0.01217 and 0.01260 BTC range during all of yesterday’s trading sessions. Like we predicted on Friday’s analysis, the low trading volume has caused DRK price to move sideways to the 61.8% Fibonacci retracement level at 0.012102 BTC. If the trading volume doesn’t rise, we cannot expect a more distinctive move towards the bullish or bearish sides soon.
By studying the 1 hour Cryptsy (DRK/BTC) chart from bitcoinwisdom.com and plotting the 10 hour EMA (green curve) and the 20 hour EMA (orange curve) (look at the below chart), we can conclude the following:
- Darkcoin price has been trading within the 0.01200-0.1270 BTC range for the past 48 hours or so; however, this new range was also accompanied by low trading volumes as compared to those recorded last Friday.
- Most of today’s candlesticks are in the form of “dojis” which reflects the low trading volume and the strength of support of the 61.8% Fibonacci retracement level at -.012102 BTC.
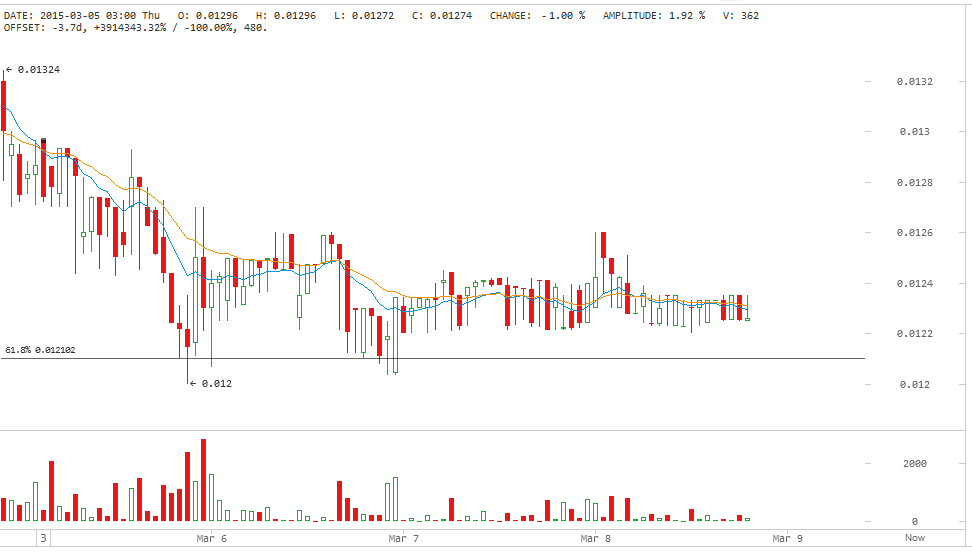
- The 0.012102 BTC support level is going to be tested again during the next 48 hours, especially if the trading volume remains low; however, our previous technical pieces have proven the strength of this support level on many occasions.
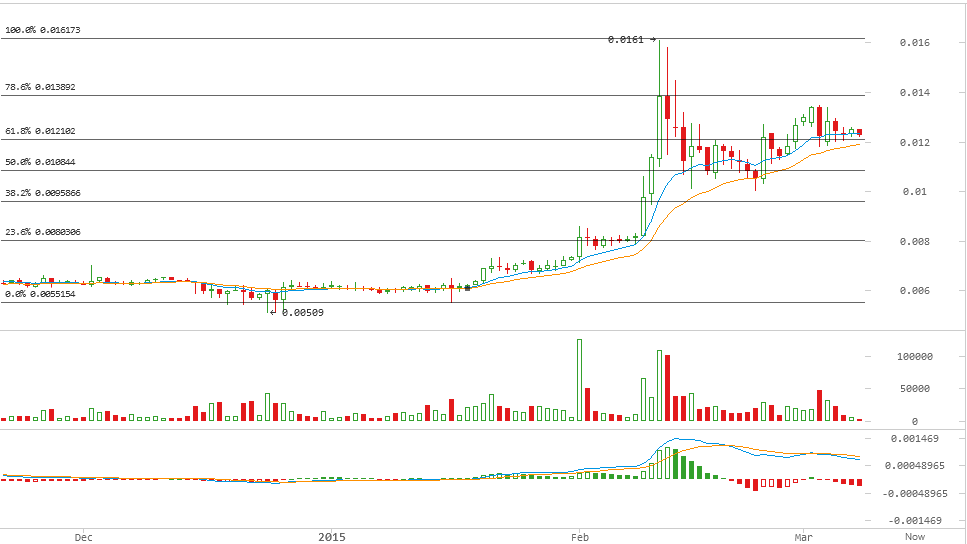
- The value of the MACD indicator is in the positive territory, yet the red signal line has crossed above the blue MACD line, so there is no sign of a bullish advance in the near future.
Conclusion:
Darkcoin price remained trading sideways to the 61.8% Fibonacci retracement level at 0.012102 BTC during all of yesterday’s and today’s trading sessions. Our technical analysis anticipates the price to continue moving between 0.01210 BTC and 0.01260 BTC during the upcoming 48 hours or so.
Charts from Cryptsy