The Darkcoin price has dropped 0.15% against Bitcoin in the last 24 hours, while it has surged 2% against the USD. Like my fellow Dr. Tamer Sameeh predicted in the previous DRK/BTC analysis, the Darkcoin price continued to trend in a sideways consolidation in absence of enough trade volume. At press time, his prediction seemed to have extended into the March 9th trading session.
Darkcoin Price 1H Cryptsy Chart
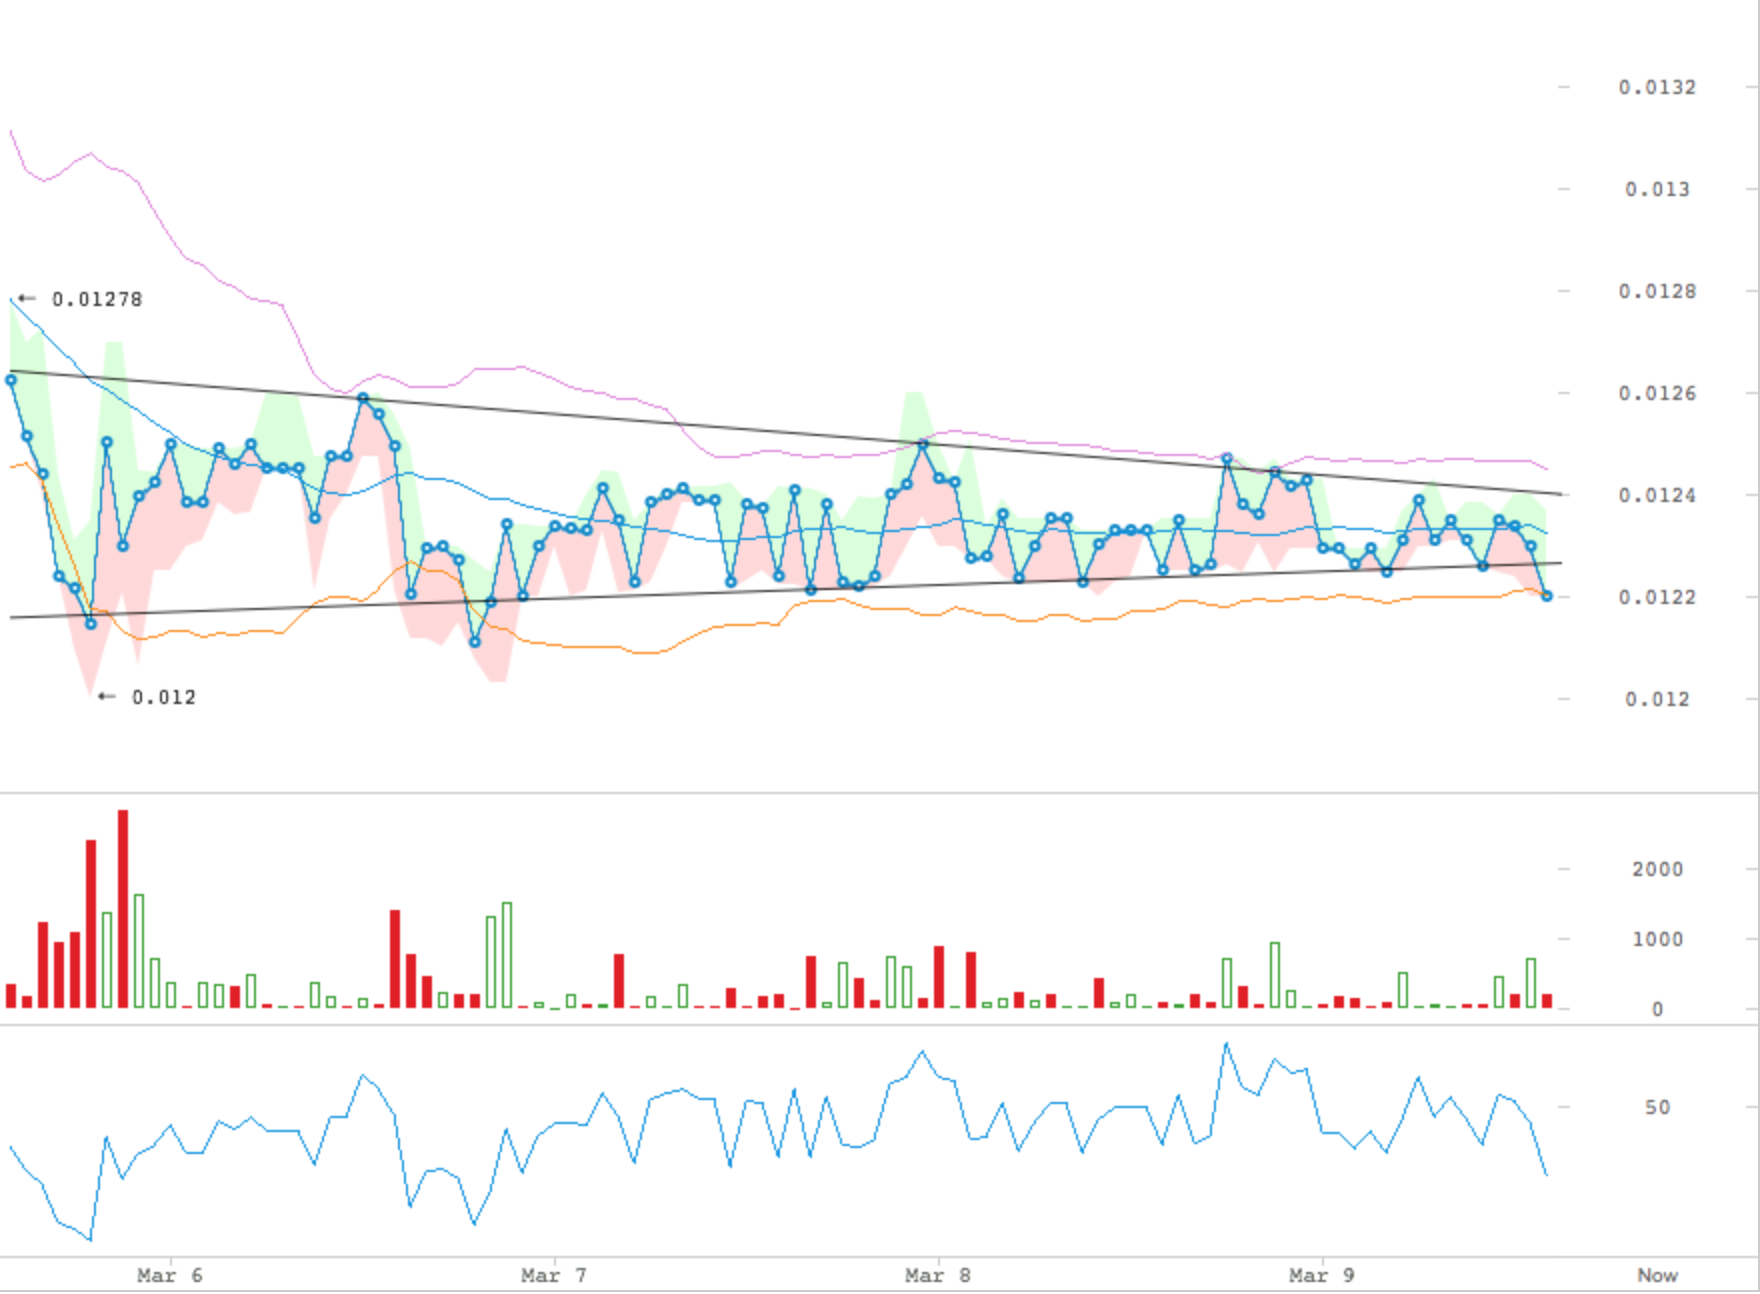
We have drawn two separate trendlines to indicate the constantly developing congestion in the Darkcoin-BTC market. The same could be indicated by the strictly parallel upper and lower Bollinger Band, which have currently sandwiched the Darkcoin price in a stiff trading range. A part of this boring sideways consolidation could be blamed on Bitcoin’s consecutive uptrends and corrections, which seems to have been offering traders a better chance to enter/exit markets on marginal profits. Therefore, Darkcoin, as well as many other altcoins, are going through the low-volume phase.
On a 1H chart, the Darkcoin price is clearly testing its long term resistance near 0.0124, while sighting the upside risk towards 0.0125. A pull back, which is very likely to occur, from the support will bring back the very closely situated support near 0.0122 in sight, while targeting 0.0121 as its downside risk level. At this point of time, a breakout towards either level would be able to give a proper price scenario. We therefore are expecting this trend to continue until the either of the support/resistance levels are broken.
The near-term dynamics meanwhile are bearish, as the Darkcoin price is clearly trending inside an oversold area, waiting for a bullish correction. The RSI meanwhile is also near 46, clearly a selling region.
Conclusion
0.0121-22 seems like a good level to enter the market with sights towards the intraday high near 0.0124. There is nothing more to expect from DRK/BTC trades until this hour.