

DarkNote Price Key Highlights
- DarkNote price started a correction phase as anticipated in yesterday’s technical analysis.
- The price is heading towards a major support area at 0.00000078BTC where buyers might appear.
- Our view of taking profits and to wait for a correction to enter a trade played well.
DarkNote price might head further lower from the current levels, but might find support near 0.00000090BTC.
Buy Dips?
The DarkNote price moved after completing a bullish outside bar candle pattern started a correction phase. We highlighted yesterday that it’s better to book profits near 0.00000090BTC and wait for another entry. It looks like the price has started correcting, and might be heading lower. In that situation, the price might find support near 0.00000078BTC. It represents a major swing area as the 50% Fib retracement level of the last wave from the 0.00000068BTC low to 0.00000089BTC high is positioned around it.
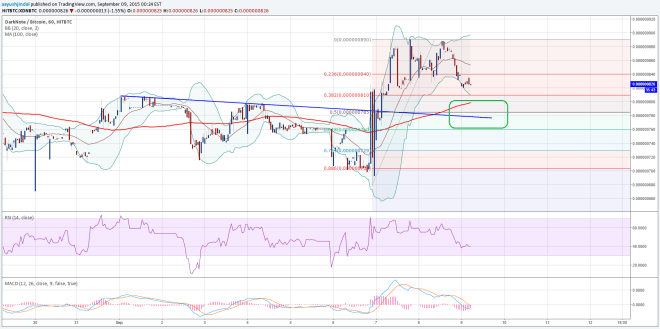

Moreover, the 100 hourly simple moving average is also aligned around the mentioned fib level along with the broken bearish trend line. A break below it might negate the bullish view and set the price for more losses in the near term. We highlighted a convergence between the hourly MACD and RSI, which is playing well and pushing the price lower.
There are more bearish signs on the hourly chart, as the RSI has moved below the 50 level, and suggesting downsides ahead. We need to see whether sellers remain in control or buyers appear around 0.00000078BTC for a move higher.
On the upside, an initial resistance is around the Middle Bollinger Band. A break above it might take the price towards the recent swing high of 0.00000089BTC moving ahead.
Intraday Support Level – 0.00000078BTC
Intraday Resistance Level – 0.00000089BTC
The hourly MACD is in the bearish zone, which is another negative sign for buyers.
Charts courtesy of Trading View