

DarkNote Price Key Highlights
- DarkNote price spiked higher and looks set for more gains in the near term.
- A bullish outside bar candle is formed on the hourly chart, suggesting an upside break is possible.
- The price has managed to settle above the 100 hourly simple moving average, which is a positive sign.
DarkNote price moved higher and currently forming a pattern, which point towards more gains moving ahead.
More Upsides?
The DarkNote price moved lower recently to trade near 0.00000068BTC where it found buyers for a move higher. There was a sharp upside reaction after the price fell close to the mentioned level. There is even a bullish outside bar candle pattern formed on the hourly chart, which is a sign that buyers are in control and more upsides are possible in the near term.
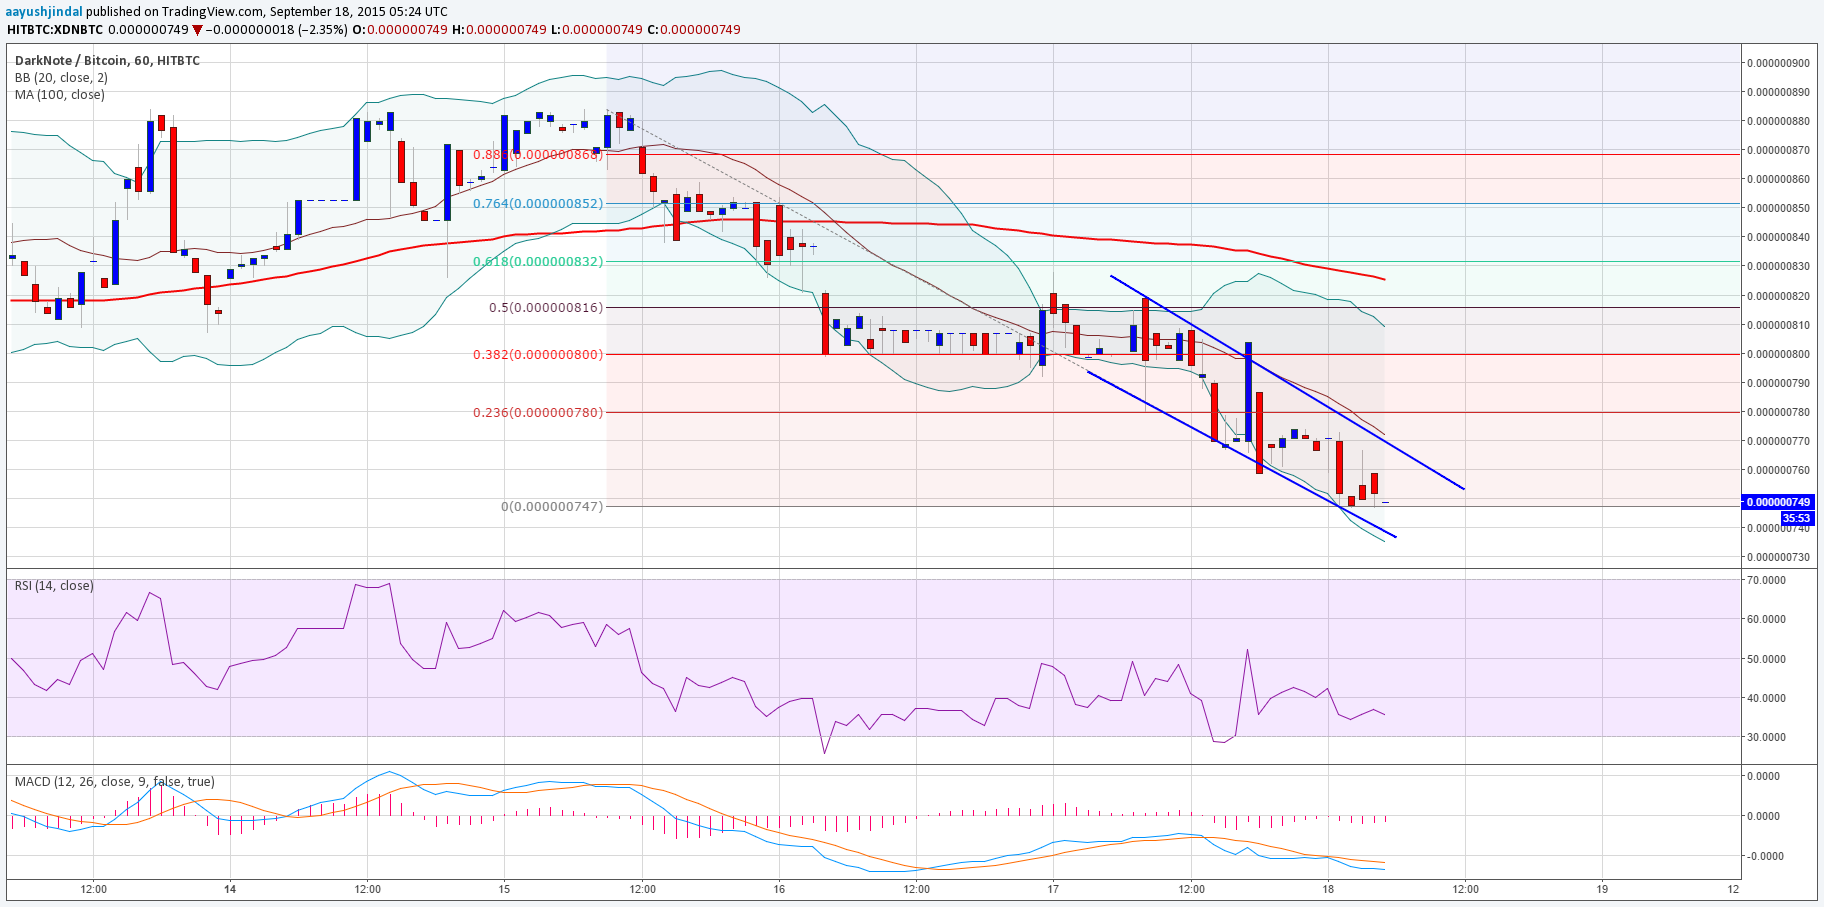
There was a bearish trend line formed on the hourly chart, which was cleared during the upside move. Moreover, the price also managed to settle above the 100 hourly simple moving average, which is one more bullish sign. If the price corrects lower from the current levels, then an initial support is formed around the 23.6% Fib retracement level of the last wave from the 0.00000068BTC low to 0.000000829BTC high. The mentioned fib level also coincides with the broken trend line and support area. So, there is a chance of buyers appearing around 0.00000078BTC if the price moves lower from the current levels.
On the upside, the recent swing high of 0.000000829BTC holds the key and can be seen as an initial resistance. A break above it might take the price towards the next resistance area at 0.00000090BTC.
Intraday Support Level – 0.00000078BTC
Intraday Resistance Level – 0.000000829BTC
The hourly MACD and RSI are well positioned in the bullish area, which means more gains are likely.
Charts courtesy of Trading View