

DarkNote Price Key Highlights
- DarkNote price tested a buy zone, which we highlighted in yesterday’s technical analysis.
- The price is struggling to hold ground as sellers remained in control, creating a risk of a break below 0.00000078BTC.
- The price has moved below the 100 hourly simple moving average, which is warning sign in the short term.
DarkNote price looks like at a risk of more losses, but as long as it is above the broken trend line there is a hope.
Risk of More Downsides?
The DarkNote price continued to move down after testing a major swing area of 0.00000090BTC and completing a bullish outside bar candle pattern. We highlighted yesterday that the price might find support near a critical area of 0.00000078BTC, as it coincides with the 50% Fib retracement level of the last wave from the 0.00000068BTC low to 0.00000089BTC high. However, it looks like buyers are struggling to hold the ground and protect the mentioned support area.
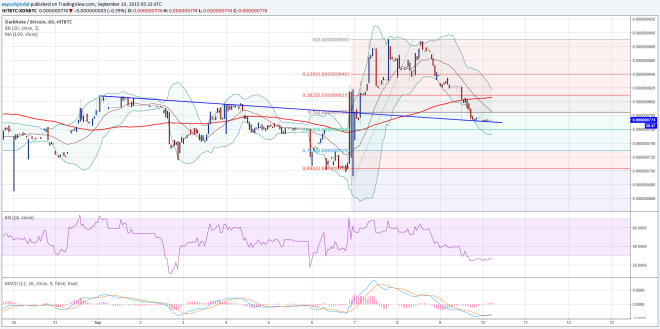

The price has moved below the 100 hourly simple moving average, which is a bearish sign in the near term. It can also be seen from the charts that the price is struggling to find buyers around 0.00000078BTC. There is a broken bearish trend line, which is acting as a hurdle for sellers. A break below it might call for more losses moving ahead, and could take the price towards the 76.4% Fib retracement level. Any further losses may push the price towards the last swing low of 0.00000068BTC where buyers might take a stand.
On the upside, the 100 hourly SMA might act as a barrier and stall gains. If buyers succeed in breaking the same, then we might witness a nice bullish wave moving ahead.
Intraday Support Level – 0.00000078BTC
Intraday Resistance Level – 0.00000081BTC
The hourly RSI is in the oversold area, suggesting a recovery is possible.
Charts courtesy of Trading View