

Key Highlights
- Dash price is under pressure as sellers managed to clear an important support at 0.01195BTC.
- A bullish trend line on the hourly chart was breached to take the price lower.
- Buyers might struggle moving ahead if sellers manage to gain momentum.
Dash price is vulnerable to more losses, and if it breaks below the 100 hourly simple moving average, a test of 0.0115BTC is likely.
Trend Line break and Reversal
There was an anticipation of an upside move as long as the bullish trend line as highlighted in the yesterday’s analysis holds. However, Dash price moved lower recently and cleared the bullish trend line to ignite more losses. The price also settled below the 23.6% Fib retracement level of the last wave from 0.0111BTC to 0.0121BTC. Moreover, there was a failure noted around the all-important 0.0120BTC resistance area.
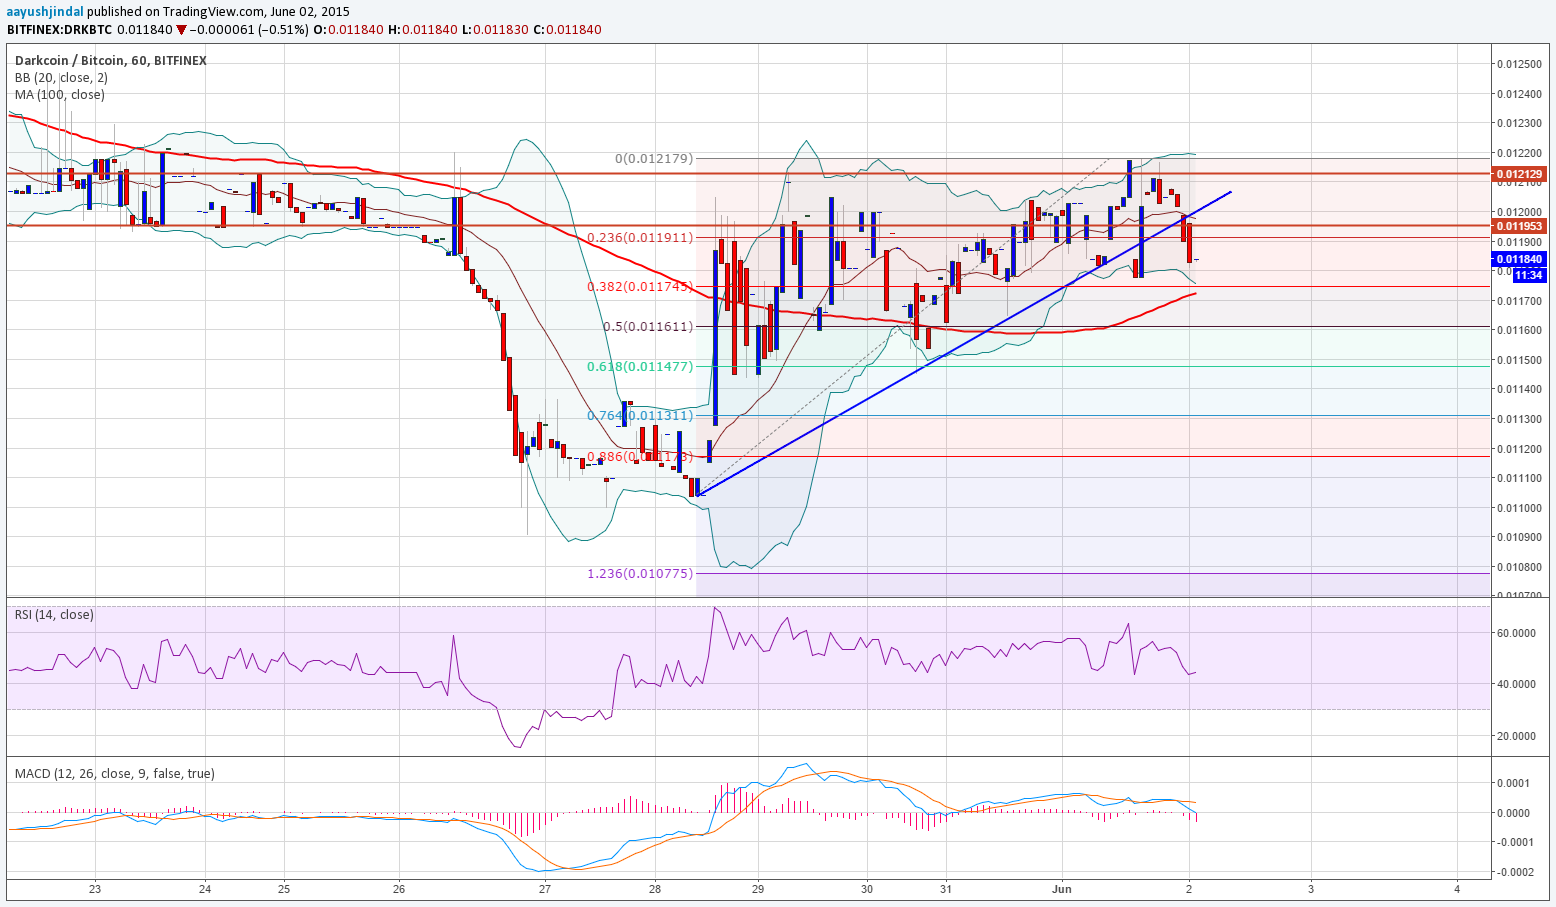
On the downside, the Lower Bollinger Band might come into play. A major support building around 0.0117BTC. There are a couple of reasons why the mentioned support holds the key for more declines moving ahead. First, the 100 hourly simple moving average is positioned at 0.0117BTC. Second, the 38.2% Fib retracement level is also aligned with the stated support area, suggesting that buyers might try to contain losses if prices move close to 0.0117BTC.
If there is a slide below 0.0117BTC, then the price might head towards 0.0112BTC, which can be considered as the next support area for buyers. The hourly RSI has moved sharply below the 50 level, pointing that the recent trend line break may not be a false one.
Intraday Support Level – 0.0117BTC
Intraday Resistance Level – 0.0120BTC
On the upside, the broken trend line might act as a resistance moving ahead. Any further gains could be limited as long as the price is below 0.0120BTC-0.0121BTC.
Charts courtesy of Trading View