Key Highlights
- Dash price traded near our highlighted triangle pattern, and managed to stay above 0.0110BTC.
- The triangle upper trend was cleared, but the break is not convincing as there was almost no follow through.
- The price is still below the 100 hourly simple moving average, which is a worrying sign for buyers.
Dash price failed once again to gain pace, but there are a few signs emerging that suggests more gains in the short term.
0.0113BTC as a Resistance
The Dash price managed to stay above an important support area of 0.0110BTC. There was a contracting triangle pattern, which we highlighted yesterday. It was a breached to open the doors for more upsides in the near term. However, there is a crucial point to note is that there was no follow through after the break, and buyers were seen struggling to clear the 100 hourly simple moving average.
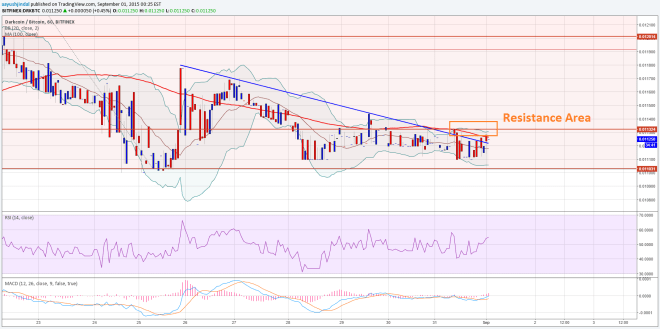

Buyers have to clear the 100 SMA in order to ignite an upside rally. An initial resistance is around 0.0113BTC, as it presents a pivot level. If there is a break above the 100 SMA, then the price could head towards the next barrier, which is around 0.0120BTC. The stated level positioned with the 23.6% Fib retracement level of the last drop from 0.0147BTC to 0.0110BTC. So, one can consider buying with a break and close above the 100 hourly SMA with a target of 0.0120BTC.
On the downside, the broken trend line may act as a support area. Any additional weakness could take the price towards the last swing low of 0.0110BTC, which holds the key in the short term.
Intraday Support Level – 0.0110BTC
Intraday Resistance Level – 0.0114TC
The hourly RSI has managed to settle above the 50 level, which is an early bullish sign.
Charts courtesy of Trading View