Reason to trust

How Our News is Made
Strict editorial policy that focuses on accuracy, relevance, and impartiality
Ad discliamer
Morbi pretium leo et nisl aliquam mollis. Quisque arcu lorem, ultricies quis pellentesque nec, ullamcorper eu odio.
The crypto market overall noted gains in the last 24 hours reversing certain effects of the recent bloodbath. Dogecoin on the other hand particularly saw some extreme choppiness over the past week or so. It is however too soon to say if the market is on its way to a solid recovery. Bitcoin was priced at $41k, as it recently toppled over the $40,000 mark marking a sharp increase by 8% over the past day.
The price of the meme-coin nose-dived by 10% since the beginning of March, ever since which all eyes have been fixed on Dogecoin. Although Dogecoin in the last week had managed to secure a break-out from the downtrend, the bears continued to claw the price momentum down.
Related Reading | Bitcoin Trading Volume Has Now Stabilized At High Values, But For How Long?
Price Analysis: DOGE/USD Four-Hour Chart

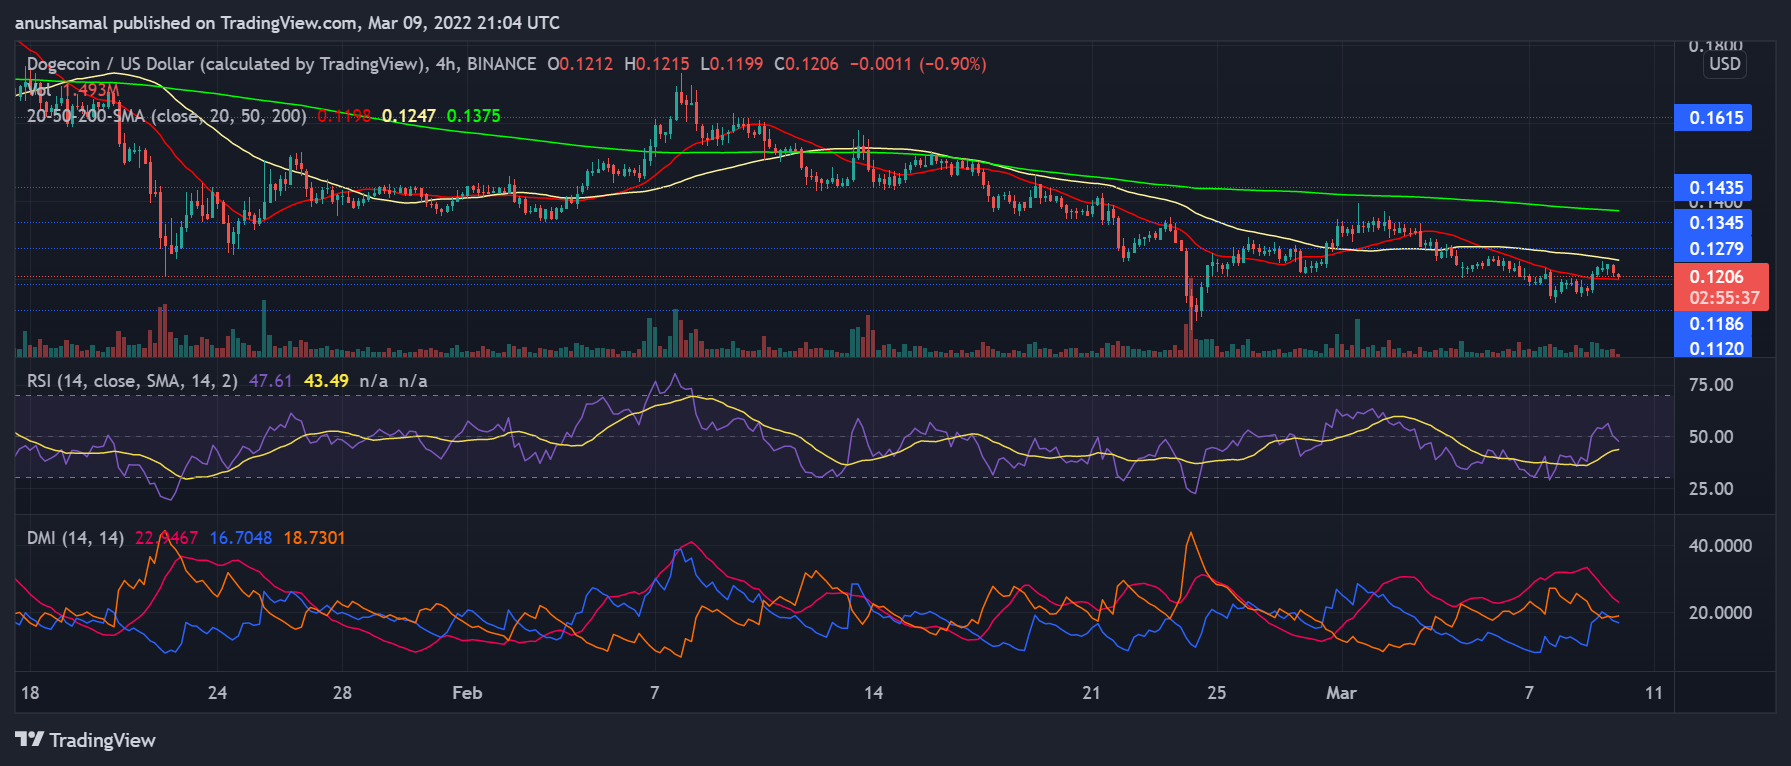
The price of Dogecoin stands at $0.120 at the time of writing. On February 24, the meme-coin had plummeted to a multi-month low of $0.112. At press time, the coin manages to stand just a few notches above the aforementioned price.
In the last 24 hours, however, Dogecoin has tried to break out of the downtrend. The coin managed to revisit the $0.118 price floor, however, the bulls have most likely jumped ship again and Dogecoin is back to trading close to the $0.118 price support line. With a continued downtrend, Doge could again target its ten-month low price level of $0.112.
The technical outlook of the coin continues to flash an extremely bearish signal as the asset witnessed selling strength again. There is a robust resistance level at the $0.134 price level as the token had tried to break past that level at the beginning of March. Doge was unable to trade anywhere close to it ever since March began.
The asset was seen trading below the 20-SMA mark which signified that sellers regained the price momentum in the market. After witnessing a death cross, as the 50-SMA line was over the 20-SMA line last week, the coin continued its downtrend. The volume of Dogecoin also flashed a decline along with the past two trading sessions closing in red as seen on the chart.
Fear Index Continues To Look Grim
For most of March so far, the market barely witnessed any buying strength, the coin has tried to bring in buyers in the past 24 hours however it failed to hold its momentum. The Relative Strength Index reflects the same reading as the indicator slowly crept below the half-line at press time, indicating a selling strength again.
Related Reading | Monero And Zcash Take Off With 15% Gains, Here’s What May Have Spurred The Rally
The Directional Movement Index was also negative which reaffirmed that buying momentum was on a decline as the -DI was above the +DI line. The Directional Movement Index usually indicates a price trend, whether the price trend is strongly up or down. The Average Directional Index also showed declining strength as it meant that the market could head into a price consolidation phase over the upcoming trading sessions.
Fear Index – Fear Index of Dogecoin scored a 22, which corresponds to “Extreme Fear” on the Index. This reading signalled that buyers were scared to buy the asset and that the asset’s price momentum was bearish in nature.


