As of today, I will start doing a daily dogecoin price technical analysis, so it is rather wise to set up resistance and support levels that will guide us through our analysis during the upcoming couple of weeks.
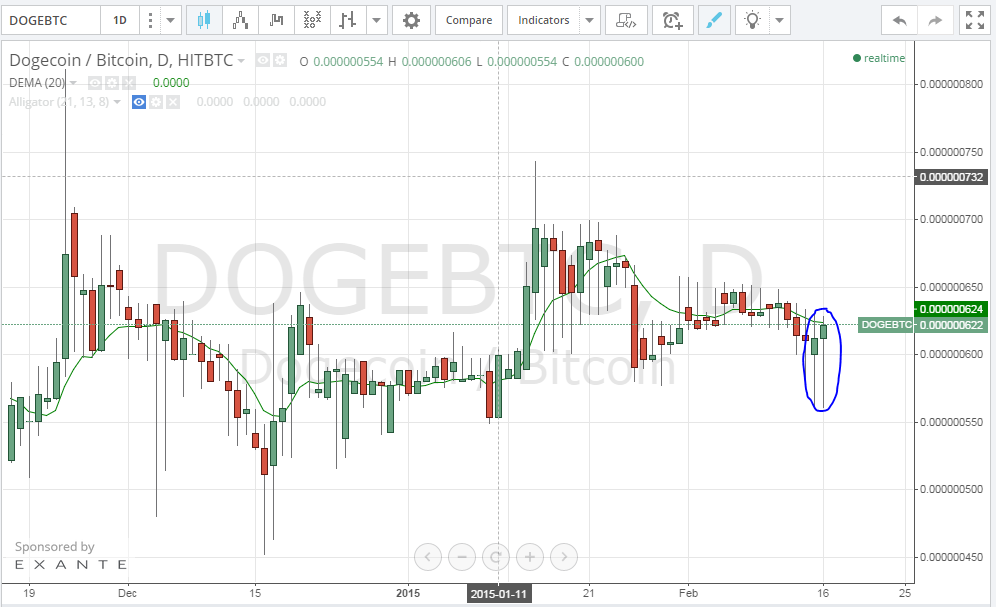
Dogecoin price increased from 59 satoshis to 61 satoshis yesterday. Although the price dropped to 56 yesterday, the bears didn’t manage to keep the downtrend rolling to keep the price down. Yesterday’s market behavior proves that the 52 satoshi level is supporting the price well, as shown by the long downwards shadows of the candlesticks corresponding to today’s and yesterday’s trading sessions (look at the pair of candles inside the blue cloud on the below chart).
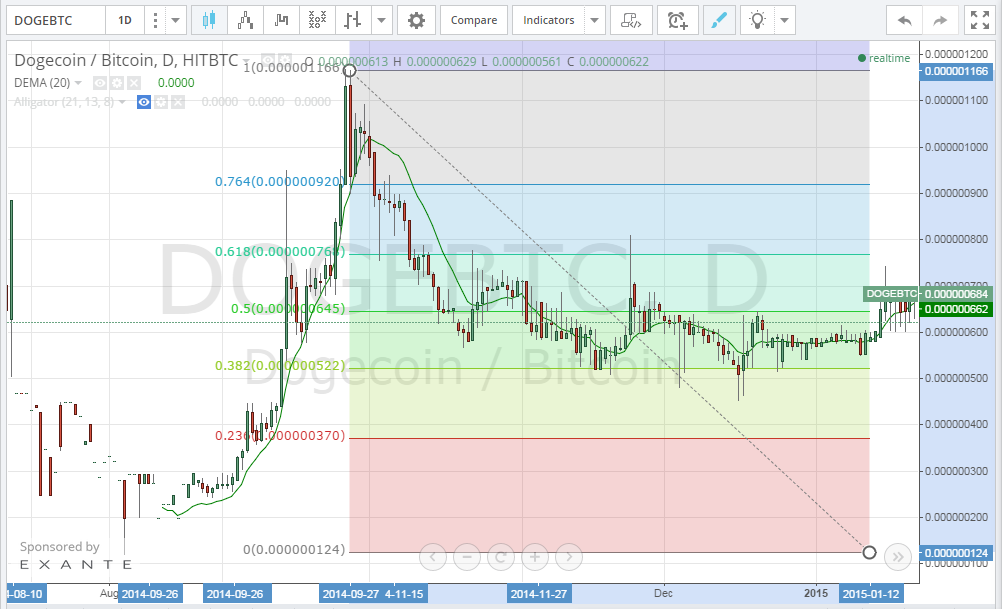
By drawing a trend line between the high reached on the 22nd of September 2014 (116 satoshis) and the low reached on the 4th of August 2014 (12 satoshis) on the 1 day Hitbtc DOGE/BTC charts from tradingview.com and plotting the Fibonnaci retracements accordingly (look at the below chart), we can conclude that the price can drop down to around 52 satoshis to touch the 38% Fibonacci retracement level, before it would rise again to touch the 50% Fibonacci retracement level.
Almost a month ago, dogecoin price started to deviate away from bitcoin price. In other words, while bitcoin price was falling, dogecoin price pushed up to 74 satoshi. Accordingly, although some might see that it is inappropriate to do technical analysis for (Doge/BTC) charts, we consider that Dogecoin price has started to exhibit independence from bitcoin price which justifies our choice.
Conclusion:
Dogecoin price proved the strength of support at the 52 satoshi level. A rise to 64 satoshis is expected to be noticeable within 24 hours.
Charts from Hitbtc