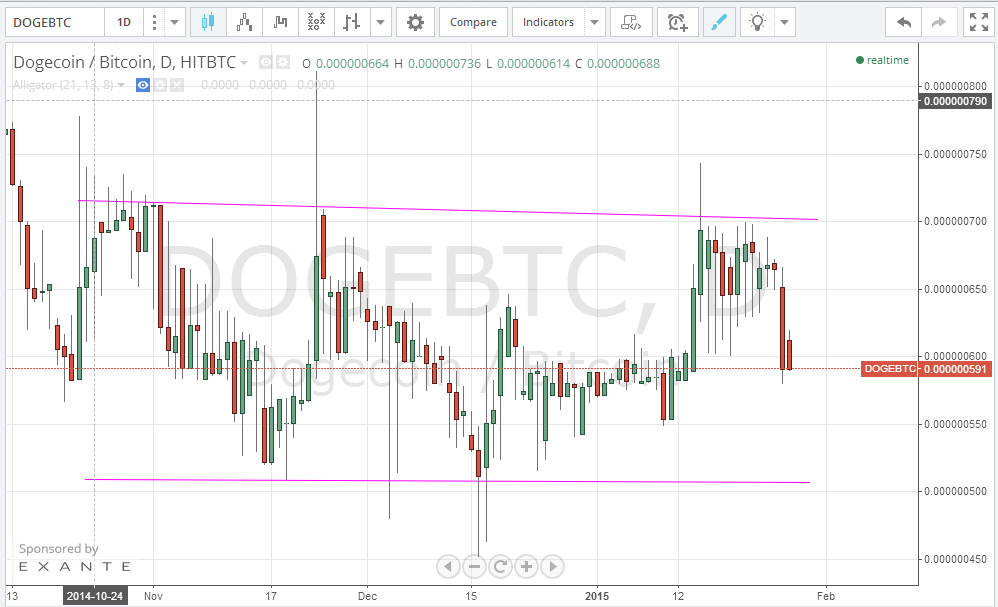
The price of Dogecoin declined over the past week (21st-27th of January) from 70 to 61 satoshis at the time of writing of this article.
By studying the 1 day Hitbtc DOGE/BTC charts from tradingview.com (look at the below chart), we can clearly see a bullish rally that pushed the price of Doge up to around 74 satoshis on the 14th and 15th of January; this coincided with the fall in the price of bitcoin which dropped to $162 on the 14th of January. Since last November, the price of Dogecoin seems to have been oscillating between 70 and 51 satoshis (look at the 2 pink trend lines on the below chart).
By drawing a trend line between the high reached on the 22nd of September 2014 (116 satoshis) and the low reached on the 4th of August 2014 (12 satoshis) on the 1 week Hitbtc DOGE/BTC charts from tradingview.com and plotting the Fibonnaci retracement fan accordingly (look at the below chart), we can conclude that the price can drop down to around 52 satoshis to touch the 0.618 Fibonacci resistance fan line, before it would rise again to touch the 0.5 fan line.
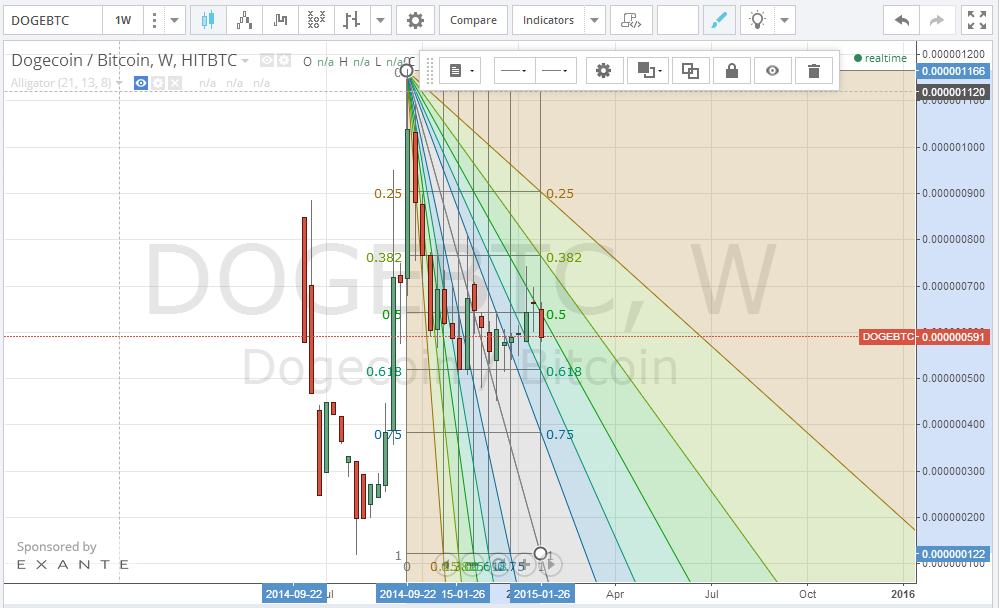
Dogecoin price is likely to drop down to the 52 satoshi support line next week, before we can see a bullish wave pulling the price upwards.
Important note: Given the low volume of Dogecoin trading and its high volatility, technical analysis shouldn’t be used as your only guide to trading Dogecoin and other altcoins.
Images from Hitbtc