

Key Highlights
- Dogecoin price weakened Intraday, as forecasted recently, but there was a sharp reaction around 68.0
- A bearish trend line as highlighted yesterday is acting as a resistance for more upsides.
- A failure to break the stated trend line might ignite a down-move in the near term.
Dogecoin price was completely rejected around 68.0 Satoshis, but the bearish trend line holds the key moving ahead.
Trend Line as Pivot
Dogecoin dived Intraday after a rejection around an important bearish trend line on the hourly chart. The price cleared a monster support area of 70.0 Satoshis to trade near 68.0 Satoshis. However, buyers managed to defend the mentioned level successfully and pushed the price back above 70.0 Satoshis. It can be considered as a positive sign, but the highlighted bearish trend is again acting as a barrier for more gains. As long as the price is below the same it remains at risk of a move lower.
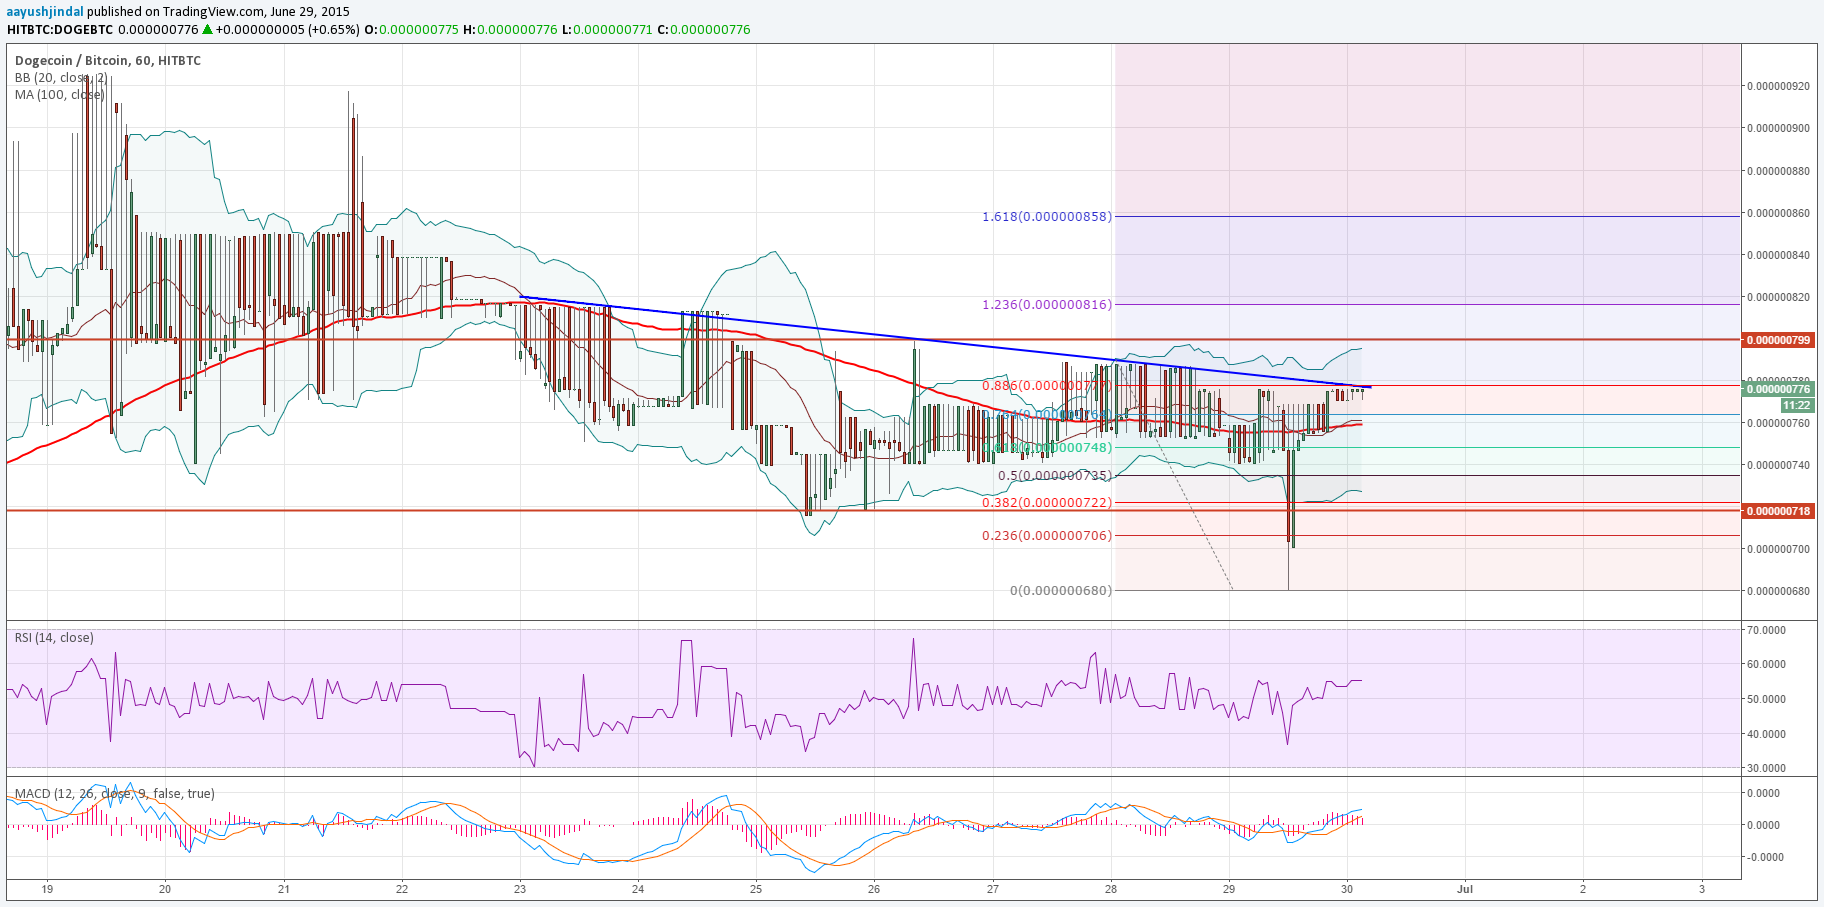
Currently, the price is trading around the highlighted trend line and the 88.6 % Fib retracement level of the last drop from 78.8 Satoshis to 68.0 Satoshis. Let us see whether buyers can manage to break the resistance area or not. A break and close above 80.0 Satoshis might be considered as a bullish sign. One important point to note is the fact that the price is well above the 100 hourly simple moving average. Moreover, the hourly RSI is above the 50 level, signaling more gains in the near term. There is hardly any negative sign, as the MACD is also titled towards the bullish slope.
On the downside, the 100 SMA might act as a support if the price moves lower from here.
Intraday Support Level – 75.0 Satoshis
Intraday Resistance Level – 80.0 Satoshis
In short buying dips can be considered as long as the price is above the 100 SMA.
Charts courtesy of Trading View