
Reason to trust
How Our News is Made
Strict editorial policy that focuses on accuracy, relevance, and impartiality
Ad discliamer
Morbi pretium leo et nisl aliquam mollis. Quisque arcu lorem, ultricies quis pellentesque nec, ullamcorper eu odio.
Ethereum rallied recently above the $235 resistance region against the US Dollar. ETH is currently correcting gains, but the $230 support might act as a strong buy zone.
- Ethereum is trading in a positive zone above the $230 and $232 levels.
- The price rallied above the $240 level and it is currently correcting gains from $244.
- There was a break below a connecting bullish trend line with support near $240 on the hourly chart of ETH/USD (data feed via Kraken).
- The pair is likely to find a strong buying interest near the $232 and $230 levels in the near term.
Ethereum Price Turns Green
In the past few hours, there was a strong bullish price action in Ethereum against the US Dollar. ETH price gained traction and rallied above the $230 and $235 resistance levels.
The upward move was such that the price even spiked above the $240 level and it settled above the 100 hourly simple moving average. A new weekly high is formed near $244 and the price is currently correcting lower.
There was a break below the $240 level, plus the 23.6% Fib retracement level of the recent rally from the $223 swing low to $244 high. Moreover, there was a break below a connecting bullish trend line with support near $240 on the hourly chart of ETH/USD.
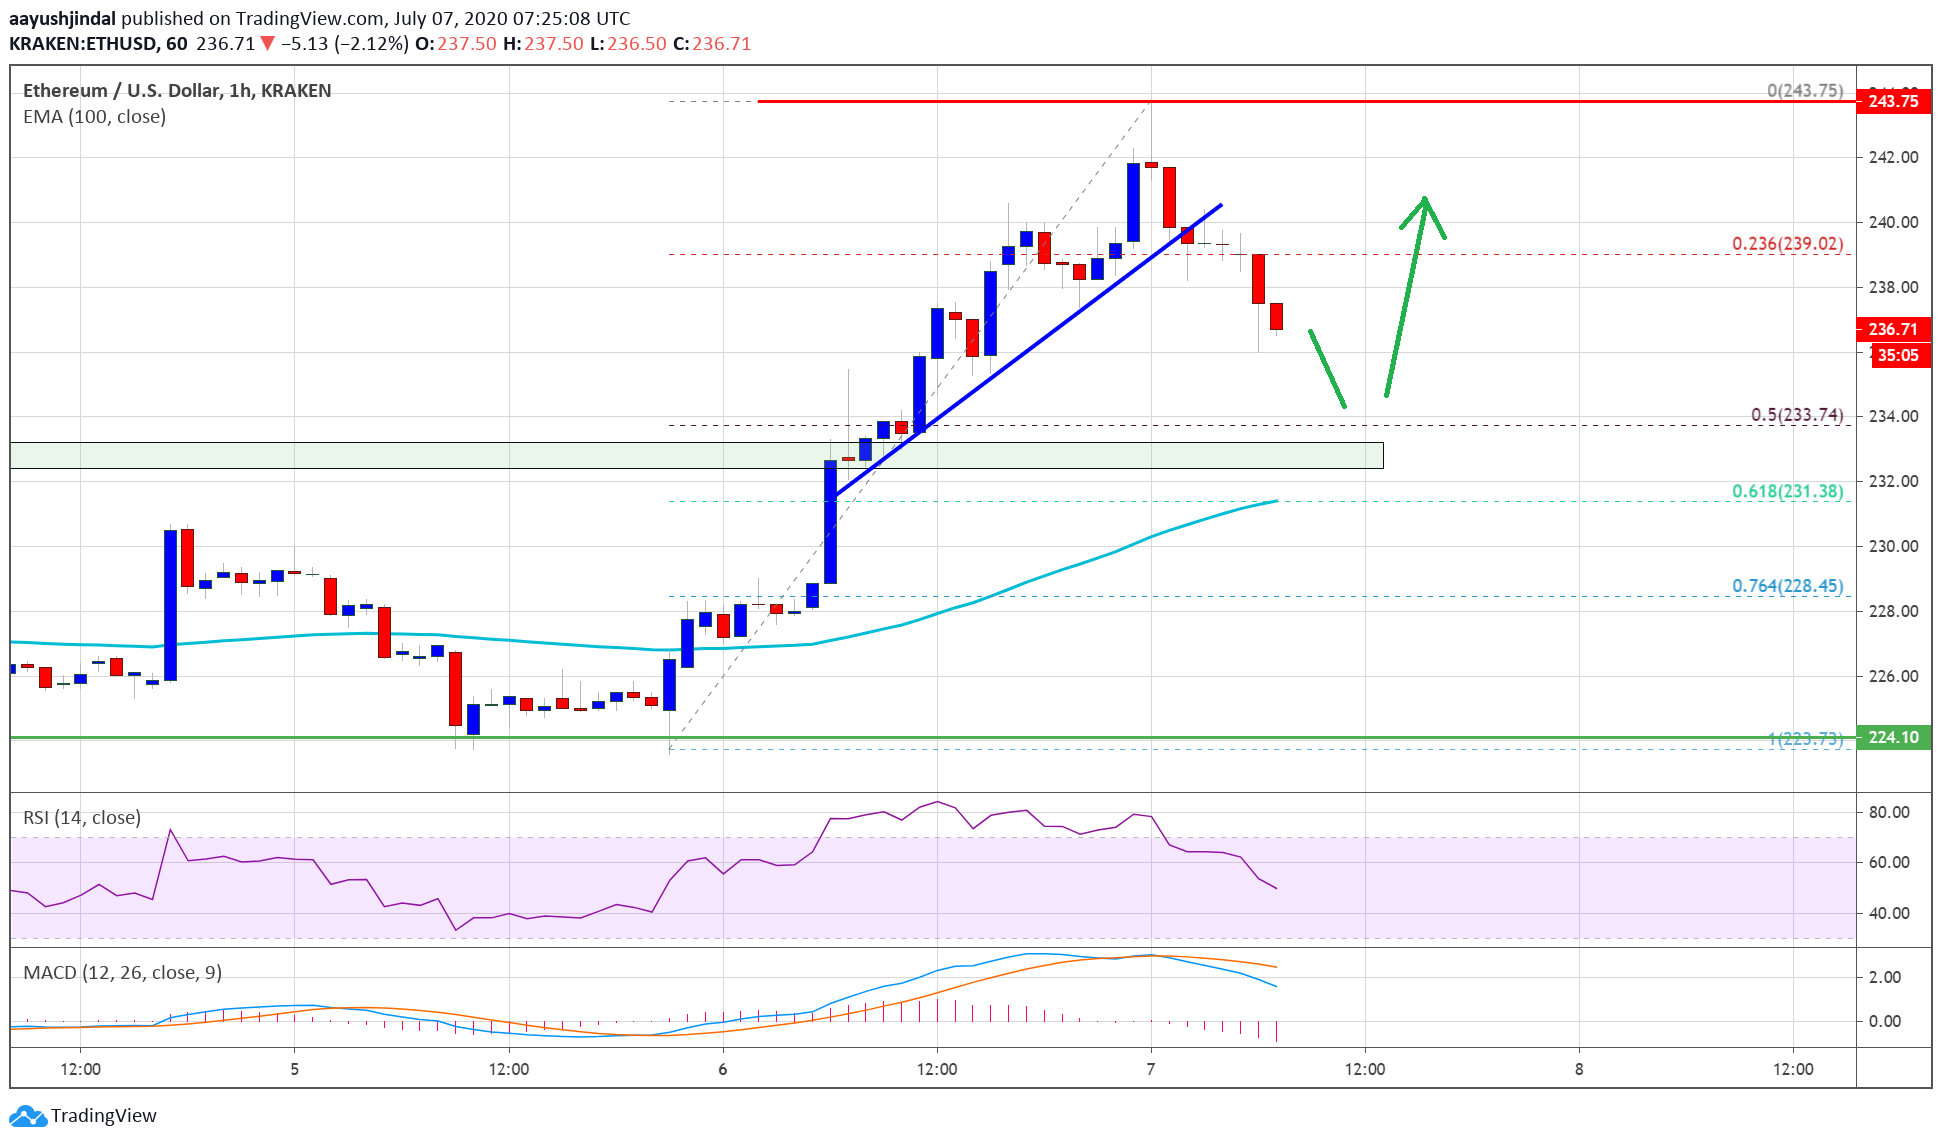
Ethereum price trades below $230. Source: TradingView.com
Ether price is currently declining towards the $235 support level. The first major support is near the $232 level or the 50% Fib retracement level of the recent rally from the $223 swing low to $244 high.
On the upside, the price is likely to face selling interest near the $240 level. A successful break above the $240 and $244 resistance levels could open the doors for a strong rise towards the main $250 barrier in the coming sessions.
Bearish Break in ETH?
On the downside, the $232 region is likely to act as a strong buy zone. The next key support is seen near the $230 level (a significant breakout zone).
If there is a downside break and close below the $230 level, Ethereum is likely to move back into a bearish zone in the near term.
Technical Indicators
Hourly MACD – The MACD for ETH/USD is losing momentum in the bullish zone.
Hourly RSI – The RSI for ETH/USD is currently correcting lower towards the 50 level.
Major Support Level – $232
Major Resistance Level – $240
Take advantage of the trading opportunities with Plus500
Risk disclaimer: 76.4% of retail CFD accounts lose money.


