
Key Highlights
- Ethereum classic price started recovering this past week against the Bitcoin, and moved above 0.00120BTC.
- There is now a bullish trend line formed on the hourly chart of ETC/BTC (data feed via Simplefx), which may act as a support on the downside.
- The price is currently correcting lower, but remains supported on the downside.
Ethereum classic price started moving higher against the Bitcoin to trade as high as 0.00145BTC before starting a correction.
Ethereum Classic Price Trend Line Support
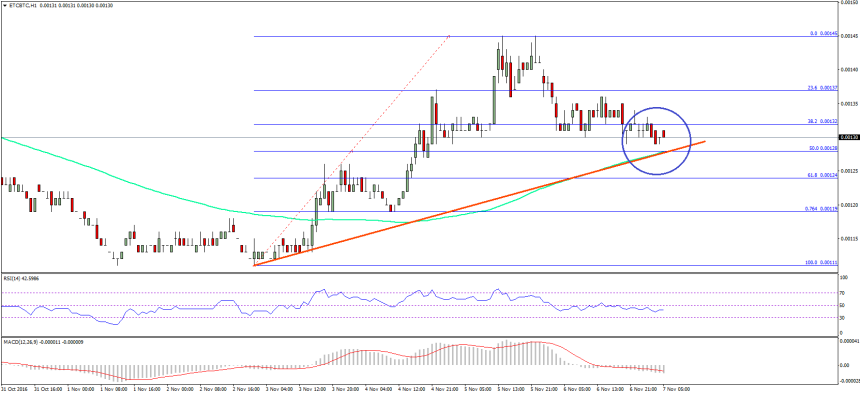
I highlighted this past week that ETC price may have started a recovery phase. The price did move higher and climbed above a couple of important resistance levels. It broke the all-important 0.00120BTC for a move higher. A new monthly high of 0.00145BTC was formed where sellers appeared and pushed the price down. It has already moved below the Fib retracement level of the last wave from the 0.00111BTC low to 0.00145BTC high.
However, the price is approaching a major support area. There is a bullish trend line formed on the hourly chart of ETC/BTC (data feed via Simplefx). It may act as a strong buy zone on the downside, as the 100 hourly simple moving average is also positioned near it. Lastly, the 50% Fib retracement level of the last wave from the 0.00111BTC low to 0.00145BTC high is also around the same trend line.
So, the highlighted trend line support holds a lot value at 0.00128BTC, and it won’t be easy for the sellers to break it. As long as the price is above 0.00125BTC, there is a chance of an upside move once again. The last swing high of 0.00145BTC may also be tested.
Hourly MACD – The MACD is now in the bearish zone, but may soon reverse.
Hourly RSI – The RSI is back below the 50 level, but there is no major bearish momentum.
Major Support Level – 0.00125BTC
Major Resistance Level – 0.00140BTC
Charts courtesy – SimpleFX