Key Highlights
- Ethereum classic price after creating another low against the Bitcoin at 0.00091BTC started correcting higher.
- There was a bearish trend line formed on the hourly chart (data feed via Simplefx) of ETC/BTC, which was broken to start a short-term correction.
- The price during the upside move stopped at 0.00100BTC, which acted as a resistance.
Ethereum classic price declined further versus the Bitcoin, and traded as low as 0.00091BTC before starting a short-term correction.
Ethereum Classic Price Resistance
ETC price traded further lower against the Bitcoin, moved below the last swing low of 0.00092BTC and traded at 0.00091BTC. The price then started a minor recovery and moved above the 23.6% Fib retracement level of the last drop from the 0.00111BTC high to 0.00091BTC low. The price even traded a bit higher, but the upside move found sellers near 0.00100BTC.
The stated level represents a major resistance, as it was a support earlier and now acting as a hurdle for an upside move. Moreover, the same level is positioned with the 38.2% Fib retracement level of the last drop from the 0.00111BTC high to 0.00091BTC low and the 100-hourly simple moving average. An important point was the fact that during the upside move, there was a break above a bearish trend line formed on the hourly chart (data feed via Simplefx) of ETC/BTC.
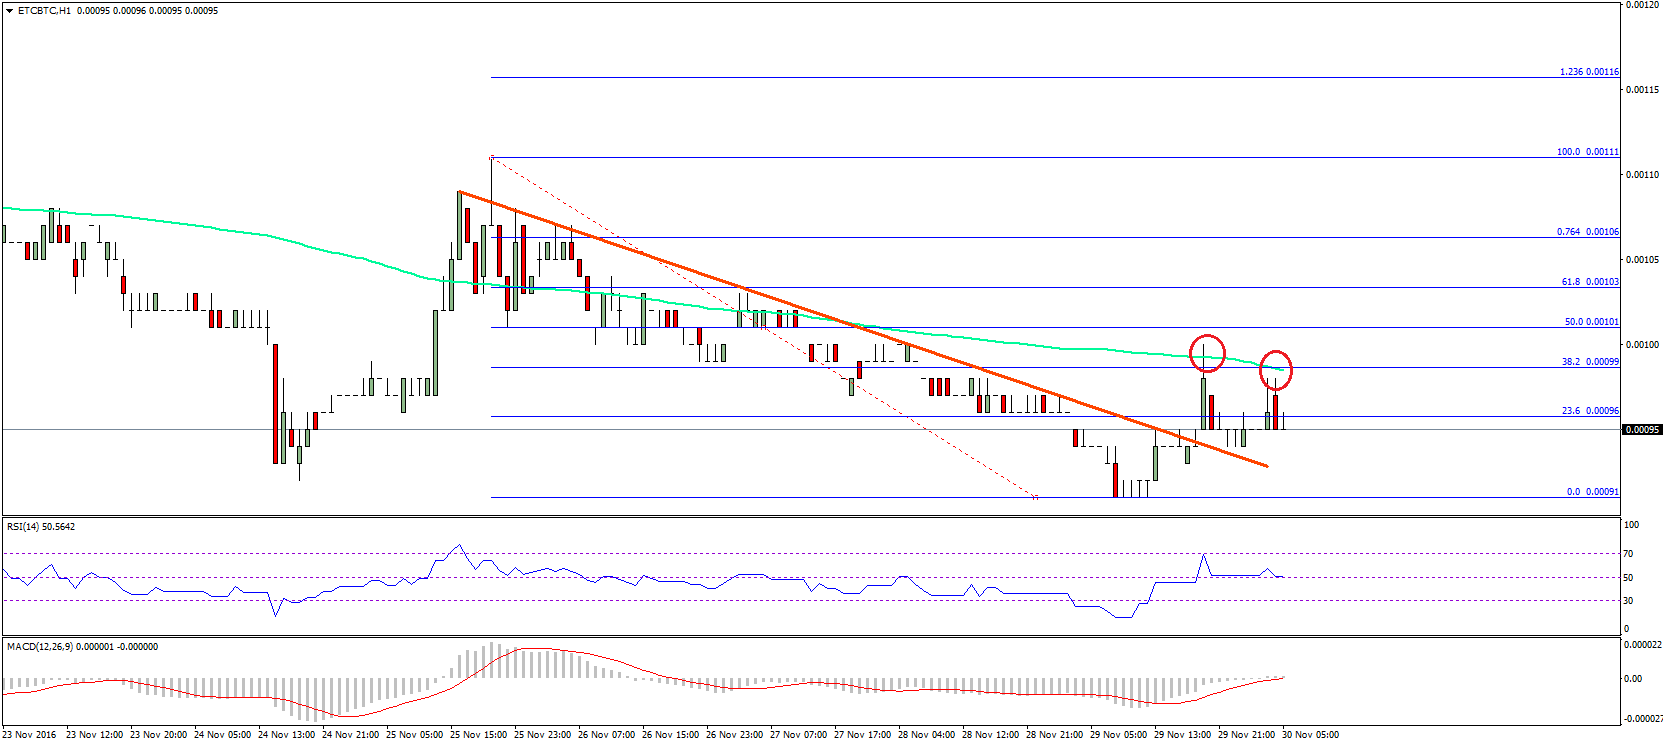
It looks like the short-term correction is now over, and the price may once again move down. The 100 hourly SMA acted as a perfect barrier for the upside. We need to see whether the broken trend line may now act as a support or not. The overall trend is bearish and may continue in the near term.
Hourly MACD – The MACD is attempting to move into the bullish zone.
Hourly RSI – The RSI has moved above the 50 level, but may move down again.
Major Support Level – 0.00094BTC
Major Resistance Level – 0.00100BTC
Charts courtesy – SimpleFX