Key Highlights
- Ethereum classic price after trading towards the $16.00 level found sellers against the US Dollar.
- There was a break below a bullish trend line with support at $15.40 on the hourly chart of ETC/USD (Data feed via Kraken).
- The price might continue to move lower and could even test the $14.80 support zone.
Ethereum classic price is likely forming a short-term top versus the US Dollar and Bitcoin. ETC/USD may now decline towards $14.80-50.
Ethereum Classic Price Support
There was a slow and steady rise in ETC price towards $16.00 recently against the US Dollar. The price traded above the $14.80 resistance to trade as high as $16.03 where it faced sellers. Later, the price started a downside move below the $16.00 handle. It recently broke an important support near $15.40 and the 100 hourly simple moving average.
During the downside break, there was a break below a bullish trend line with support at $15.40 on the hourly chart of ETC/USD. The 23.6% Fib retracement level of the last wave from the $13.38 low to $16.03 high was breached. It has cleared the way for more losses in the near term towards $14.80-14.40. The next major support is around the 38.2% Fib retracement level of the last wave from the $13.38 low to $16.03 high at $14.80. The stated $14.80 support was a resistance earlier, and now a crucial support.
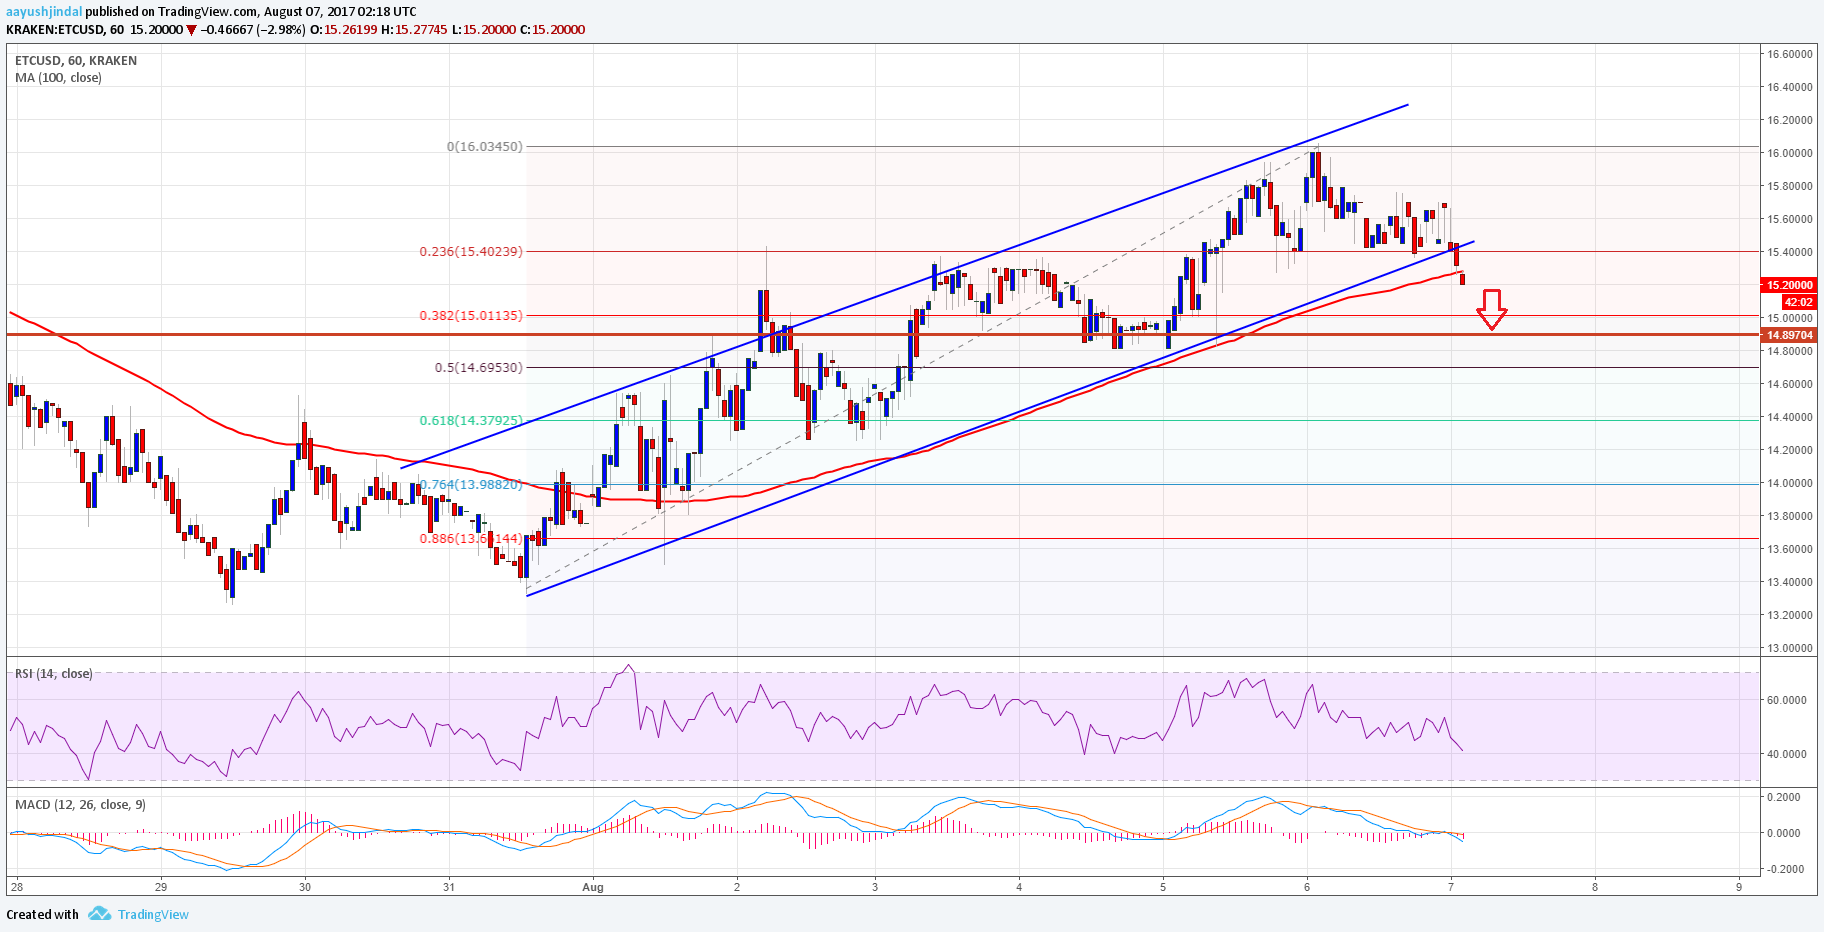
On the upside, the broken trend line near $15.40 might act as a resistance if the price corrects higher. Moreover, the 100 hourly simple moving average is also a short-term resistance near $15.35. Overall, the price may continue to trade lower and might test the $14.80 support.
Hourly MACD – The MACD has moved away from the bullish to bearish zone.
Hourly RSI – The RSI has declined below the 50 level and heading lower.
Major Support Level – $14.80
Major Resistance Level – $15.40
Charts courtesy – Trading View, Kraken