Reason to trust
How Our News is Made
Strict editorial policy that focuses on accuracy, relevance, and impartiality
Ad discliamer
Morbi pretium leo et nisl aliquam mollis. Quisque arcu lorem, ultricies quis pellentesque nec, ullamcorper eu odio.
Ethereum is showing positive signs and it traded to a new monthly high at $281 against the US Dollar. ETH price likely to continue higher as long as it is above $260.
- Ethereum extended its rally above the $270 and $275 resistance levels.
- The price traded to a new monthly high at $281 and it is currently correcting lower.
- There is a new contracting triangle forming with resistance near $272 on the hourly chart of ETH/USD (data feed via Kraken).
- The pair is likely to break to the upside and continue higher towards $280 and $288.
Ethereum Price Gaining Bullish Momentum
In the past few days, there was a steady increase in Ethereum above the $250 resistance against the US Dollar. ETH price settled above the $260 resistance and the 100 hourly simple moving average.
The recent upward move was such that ether price gained more than bitcoin, and climbed above the $270 resistance. It even spiked above the $280 level and traded to a new monthly high at $281.
It is currently correcting lower and trading below the $275 level. There was a break below the 23.6% Fib retracement level of the upward move from the $260 swing low $281 high. An immediate support is near the $270 level (the recent breakout zone).
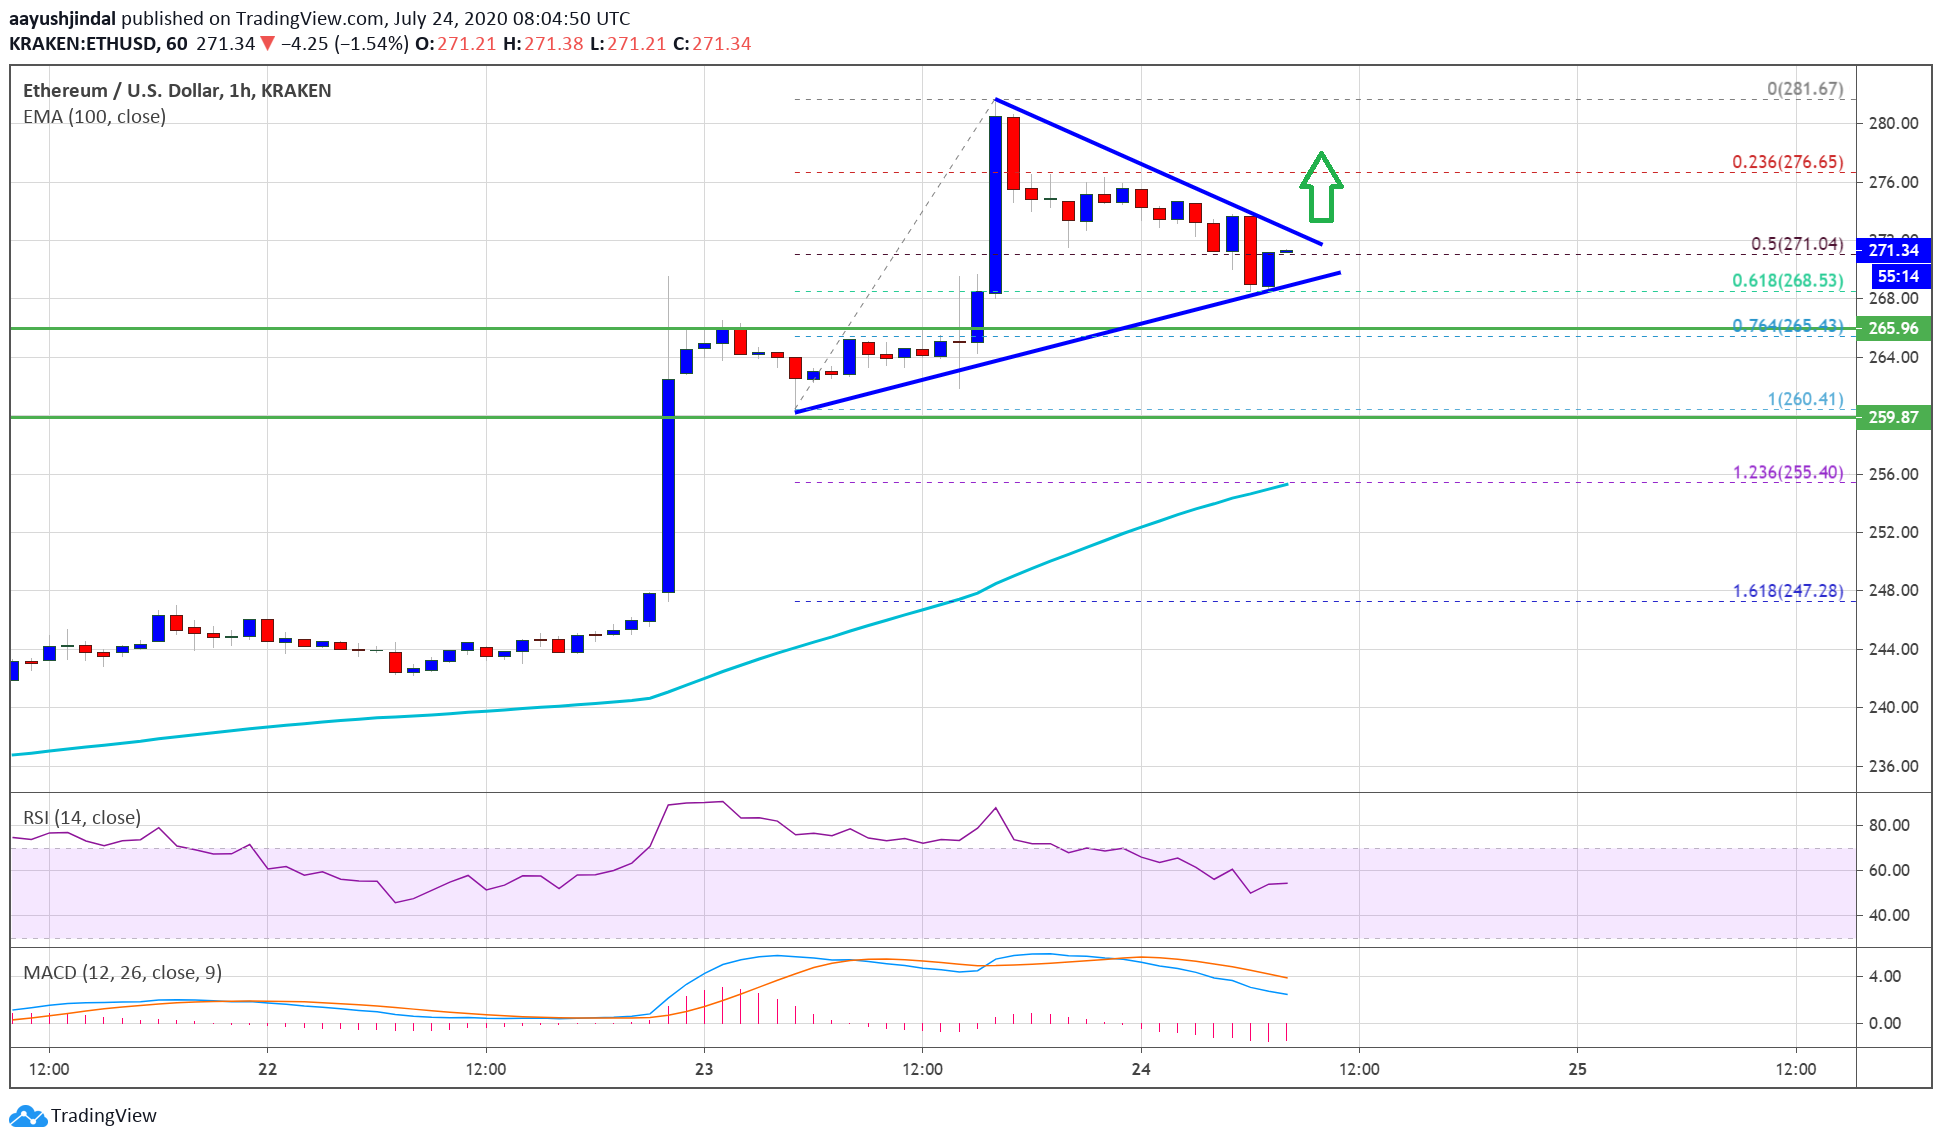
Ethereum price trades above $270. Source: TradingView.com
There is also a new contracting triangle forming with resistance near $272 on the hourly chart of ETH/USD. The triangle support is close to the 50% Fib retracement level of the upward move from the $260 swing low $281 high.
On the upside, the price is facing a couple of minor barriers near the $275 level. A clear break above the $275 resistance may perhaps open the doors for a sharp increase towards the $280 and $288 levels. The next hurdle is seen near the $300 level.
Bearish Break in ETH?
On the downside, the triangle support is near the $268-$270 zone. If there is a downside break below $268, the price could continue to move down.
The next major support is near the $260 level (the pivot zone), below which the price is likely to accelerate lower towards the $250 level.
Technical Indicators
Hourly MACD – The MACD for ETH/USD is slowly gaining pace in the bearish zone.
Hourly RSI – The RSI for ETH/USD is currently correcting lower towards the 50 level.
Major Support Level – $268
Major Resistance Level – $275
Take advantage of the trading opportunities with Plus500
Risk disclaimer: 76.4% of retail CFD accounts lose money.