
Reason to trust
How Our News is Made
Strict editorial policy that focuses on accuracy, relevance, and impartiality
Ad discliamer
Morbi pretium leo et nisl aliquam mollis. Quisque arcu lorem, ultricies quis pellentesque nec, ullamcorper eu odio.
Ethereum is slowly recovering and trading above the $225 level against the US Dollar. ETH is likely to rise sharply if it clears the $228 and $230 resistance levels.
- Ethereum is showing positive signs above the $224 and $225 support levels.
- The price is still struggling to clear the $228 and $230 resistance levels.
- There is a crucial ascending channel forming with support near $224 on the hourly chart of ETH/USD (data feed via Kraken).
- The pair could either rally above $230 or it might decline below the channel support to start another decline.
Ethereum Price is Rising Steadily
In the past few sessions, Ethereum price started a steady rise above the $220 level against the US Dollar. ETH price managed to recover above the $225 resistance level and the 100 hourly simple moving average.
However, the price failed to gain momentum above the $228 and $230 resistance levels. A high is formed near $230 and ether is currently correcting lower. It traded below the $228 level and the 100 hourly SMA.
An immediate support could be $225 since it is close to the 50% Fib retracement level of the recent wave from the $221 low to $230 high. There is also a crucial ascending channel forming with support near $224 on the hourly chart of ETH/USD.
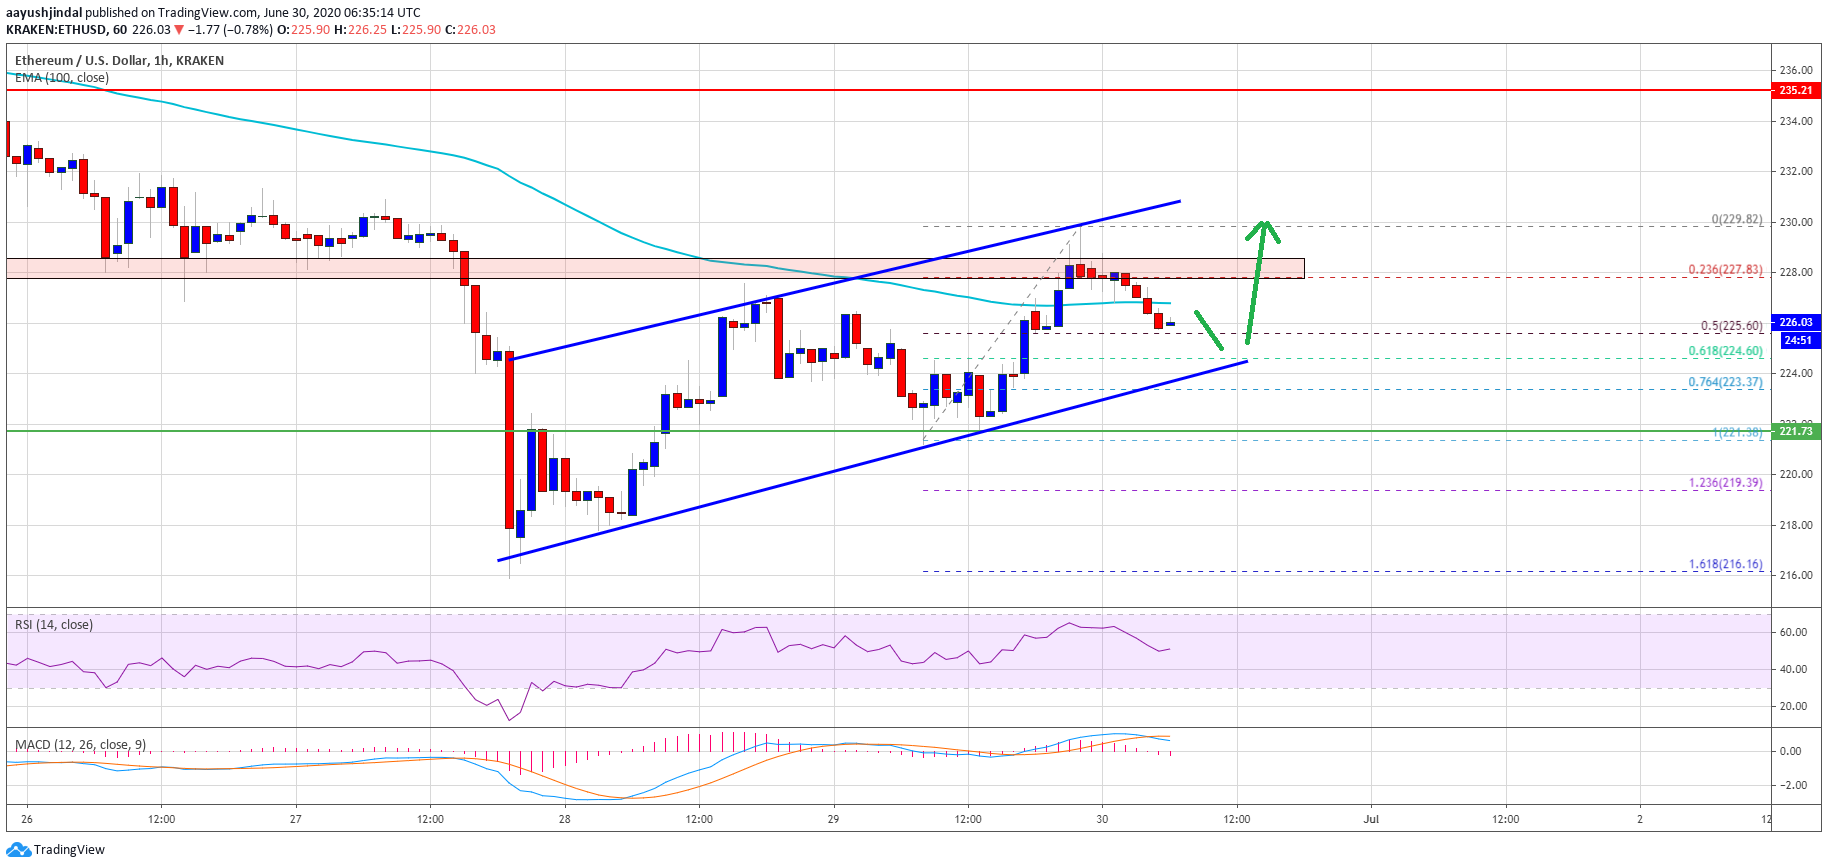
Ethereum price trades below $230. Source: TradingView.com
The channel support is close to the 61.8% Fib retracement level of the recent wave from the $221 low to $230 high. On the upside, the price is clearly struggling to clear the $228 and $230 resistance levels.
If ether price settles above the $230 resistance level, there are high chances of a sustained upward move. The next major resistance is near the $235 level, above which it could revisit the $250 resistance.
Downside Break in ETH?
If Ethereum fails to clear the $228 and $230 resistance levels, it is likely to start a fresh drop. The channel support is near the $224 level, below which the price might gain traction below $222.
A downside break below the $222 and $220 support levels may perhaps open the doors for another decline towards the $215 level. The next key support is near the $205 level.
Technical Indicators
Hourly MACD – The MACD for ETH/USD is slowly moving into the bearish zone.
Hourly RSI – The RSI for ETH/USD is currently above the 50 level, with a positive bias.
Major Support Level – $224
Major Resistance Level – $230
Take advantage of the trading opportunities with Plus500
Risk disclaimer: 76.4% of retail CFD accounts lose money.


