Reason to trust
How Our News is Made
Strict editorial policy that focuses on accuracy, relevance, and impartiality
Ad discliamer
Morbi pretium leo et nisl aliquam mollis. Quisque arcu lorem, ultricies quis pellentesque nec, ullamcorper eu odio.
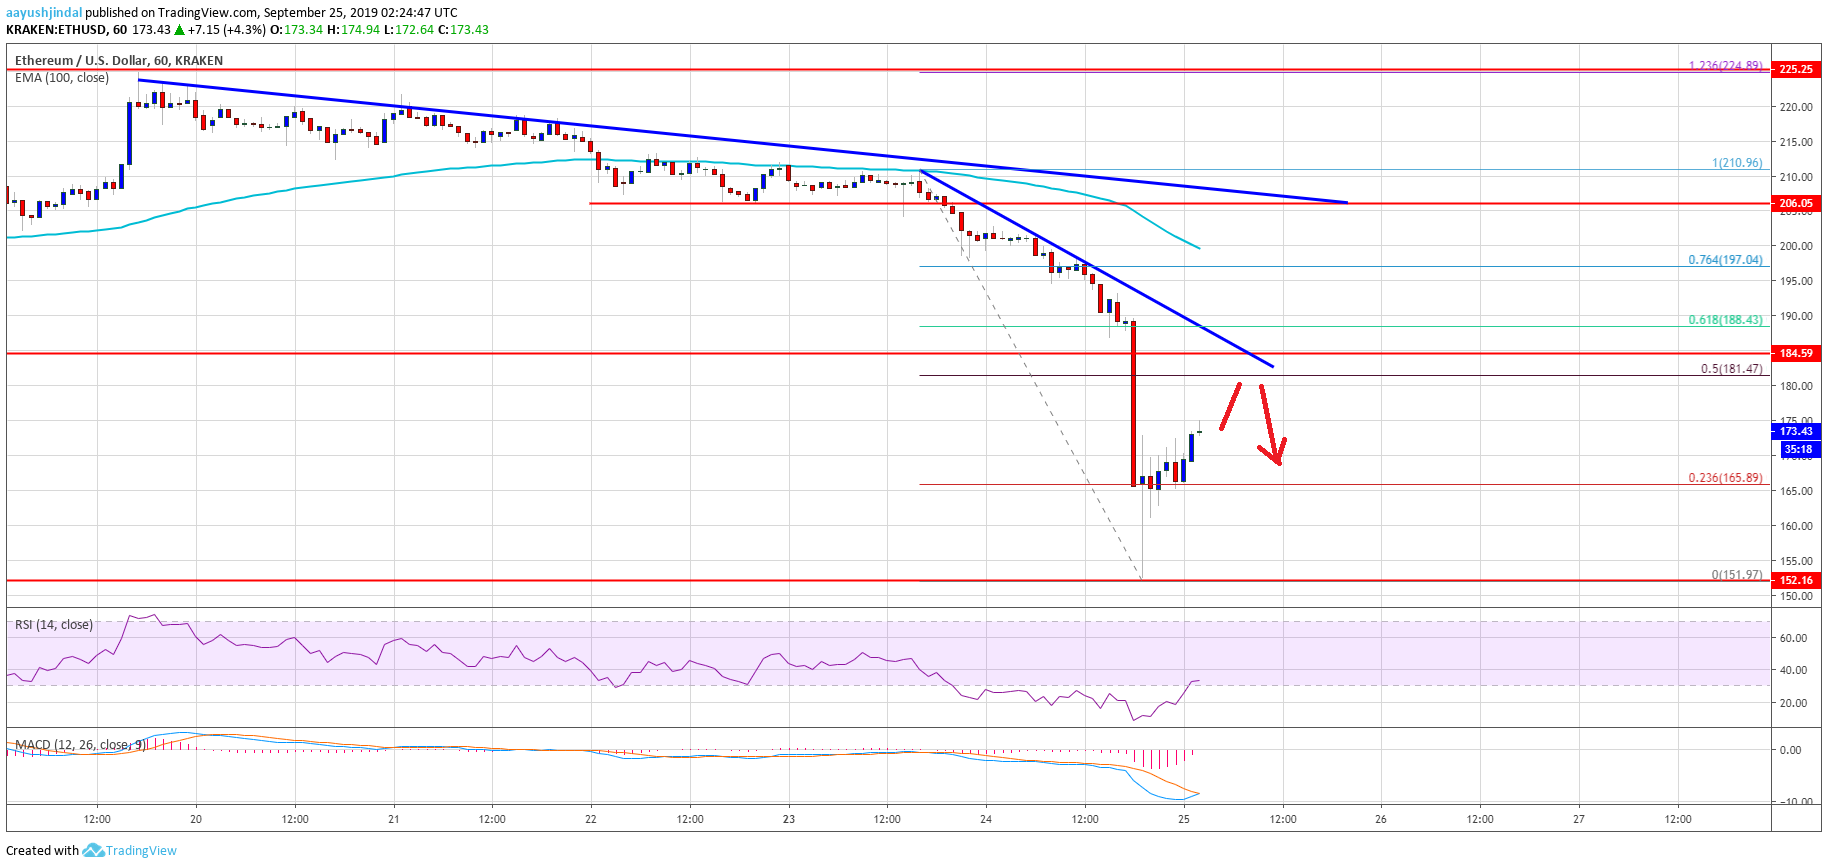
- ETH price declined heavily and tumbled more than 10% below $185 against the US Dollar.
- The price is currently correcting higher after it traded close to the $150 level.
- There is a new major bearish trend line forming with resistance near $182 on the hourly chart of ETH/USD (data feed via Kraken).
- Bitcoin price is down more than 10% and it broke the $9,000 support area.
Ethereum price is back in a downtrend below $185 versus the US Dollar, similar to bitcoin below $10,000. ETH price might correct higher, but it is likely to struggle near $185.
Ethereum Price Analysis
In the past few hours, there was a sharp decline in Ethereum, bitcoin, ripple, and major other cryptocurrencies against the US Dollar. ETH price tumbled below the $200 and $185 support levels. Moreover, there was a close below the $185 level and the 100 hourly simple moving average. The decline was such that the price crashed close to $150 on the Kraken exchange. A new monthly low was formed near $152 and the price is currently correcting higher.
There was a break above the $165 level, plus the 23.6% Fib retracement level of the recent drop from the $210 high to $152 swing low. The price is now trading above the $170 level, but there are many hurdles on the upside near the $180 and $182 levels. Moreover, there is a new major bearish trend line forming with resistance near $182 on the hourly chart of ETH/USD.
The trend line coincides with the 50% Fib retracement level of the recent drop from the $210 high to $152 swing low. More importantly, the previous support near the $185 level might once again act as a resistance. Above $185, Ethereum price could recover towards the $200 resistance area and the 100 hourly SMA. Conversely, the price could complete the current correction near the $180 or $185 resistance.
An initial support on the downside is near the $165 level. If there is a fresh decrease below $165, the price may perhaps retest the $152 low. Any further losses could push the price below the $150 support area in the coming sessions.
Looking at the chart, Ethereum price is clearly back in a downtrend with a close below $200 and $185. As long as the price is below the $185 and $200 resistances, it remains at a risk of another drop towards the $150 support in the near term.
ETH Technical Indicators
Hourly MACD – The MACD for ETH/USD is about to move back into the bullish zone.
Hourly RSI – The RSI for ETH/USD is currently correcting higher from the 10 level.
Major Support Level – $165
Major Resistance Level – $185