
Reason to trust
How Our News is Made
Strict editorial policy that focuses on accuracy, relevance, and impartiality
Ad discliamer
Morbi pretium leo et nisl aliquam mollis. Quisque arcu lorem, ultricies quis pellentesque nec, ullamcorper eu odio.
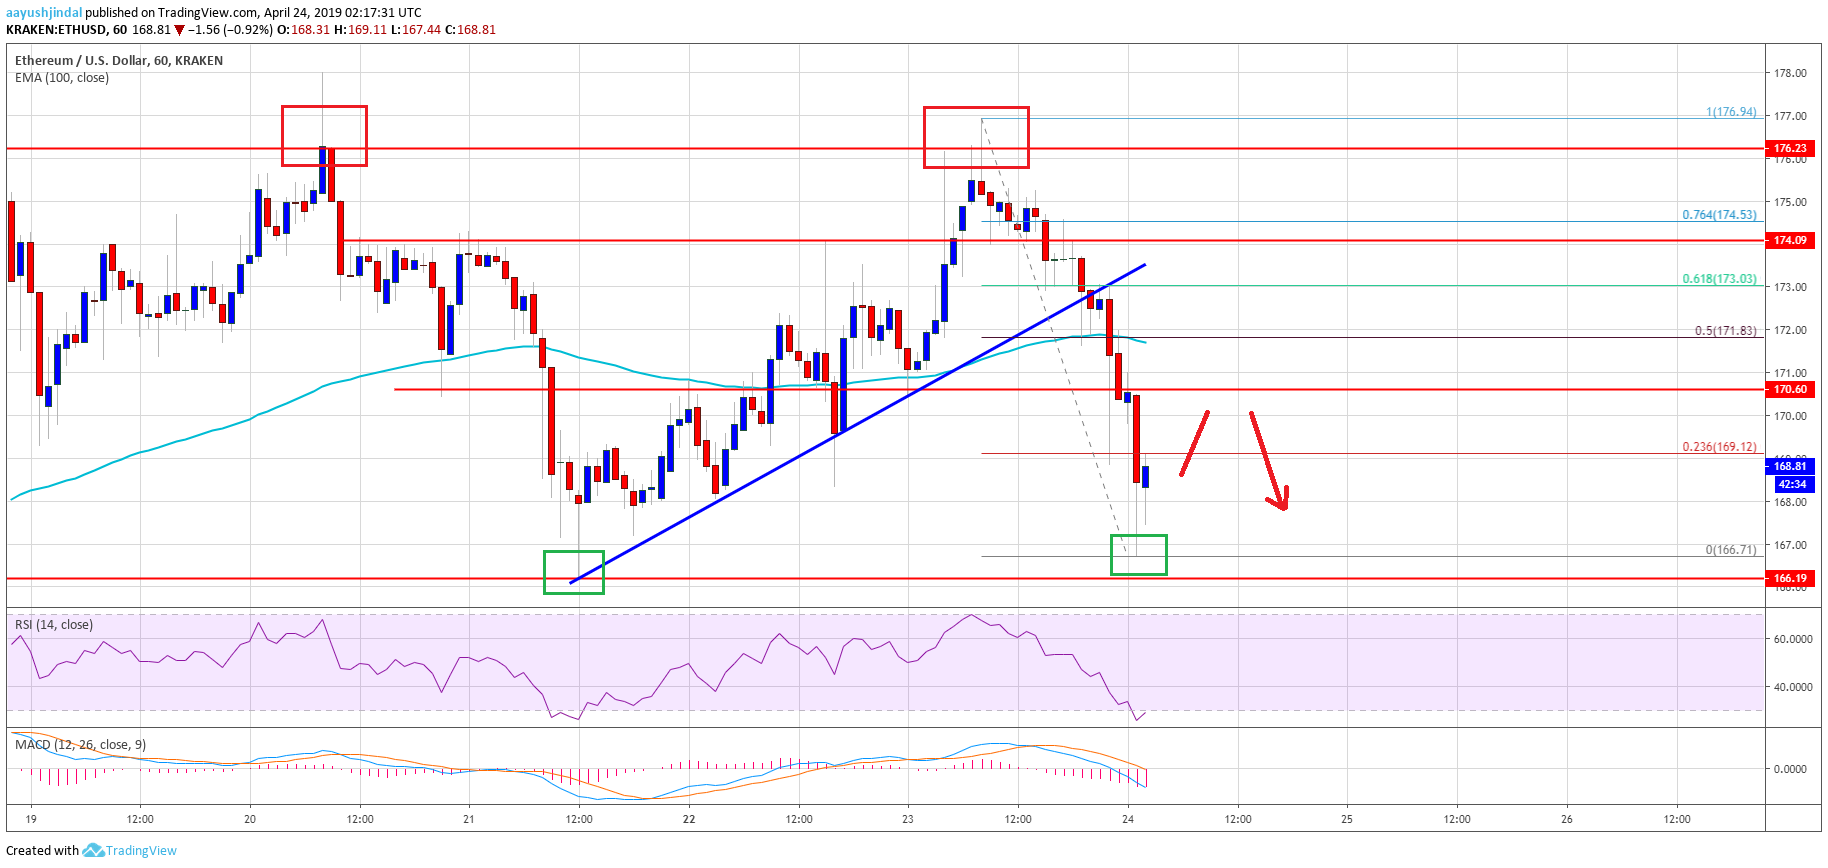
- ETH price struggled once again to gain strength above the $176 resistance against the US Dollar.
- The price declined sharply and broke the $172 and $170 support levels.
- There was a break below a major bullish trend line with support at $173 on the hourly chart of ETH/USD (data feed via Kraken).
- The pair could bounce back above $172 as long as it is trading above the $166 support area.
Ethereum price failed to break important resistances versus the US Dollar and bitcoin. ETH declined sharply, but the bulls might protected the key $166 and $165 support levels.
Ethereum Price Analysis
Yesterday, we saw a fresh increase in Ethereum price above the $172 resistance against the US Dollar. The ETH/USD pair even settled above the $172 level and the 100 hourly simple moving average. There was a fresh rally in bitcoin price above $5,500, which pushed ETH price above the $175 level. However, the bulls failed to gain strength above the key $176 and $177 resistance levels. A swing high was formed near $177 and later the price started a sharp decline.
It broke the $174, $172 and $170 support levels to move back in a bearish zone. There was also a close below the $172 pivot level and the 100 hourly SMA. The price traded close to the $166 support level and a swing low was formed near $167. At the outset, the price is consolidating losses near $167 and it is testing the 23.6% Fib retracement level of the recent slide from the $177 swing high to $167 swing low. It seems like the price might correct in the short term towards $170 or $172.
Having said that, a close above the $172 level and the 100 hourly SMA is must for a decent upward move. The 50% Fib retracement level of the recent slide from the $177 swing high to $167 swing low is also near $172. If there is a close above $172, the price may revisit the $176 and $177 resistances. If not, the price might test the $166 or $165 support level in the near term.
Looking at the chart, Ethereum price clearly trimmed most its gains and broke the key $172 and $170 supports. If sellers remain in action, there are chances of a downside extension below the $165 support. As long as the price is above $165, the bulls might attempt to push the price above $172.
ETH Technical Indicators
Hourly MACD – The MACD for ETH/USD is currently heavily in the bearish zone, with negative signs.
Hourly RSI – The RSI for ETH/USD declined heavily below 50 and it is currently near the 27 level.
Major Support Level – $166
Major Resistance Level – $172


