
Reason to trust
How Our News is Made
Strict editorial policy that focuses on accuracy, relevance, and impartiality
Ad discliamer
Morbi pretium leo et nisl aliquam mollis. Quisque arcu lorem, ultricies quis pellentesque nec, ullamcorper eu odio.
- Ethereum price is up more than 3% and recovering above $188 against the US Dollar.
- There was a decent upside correction from the $180 support area.
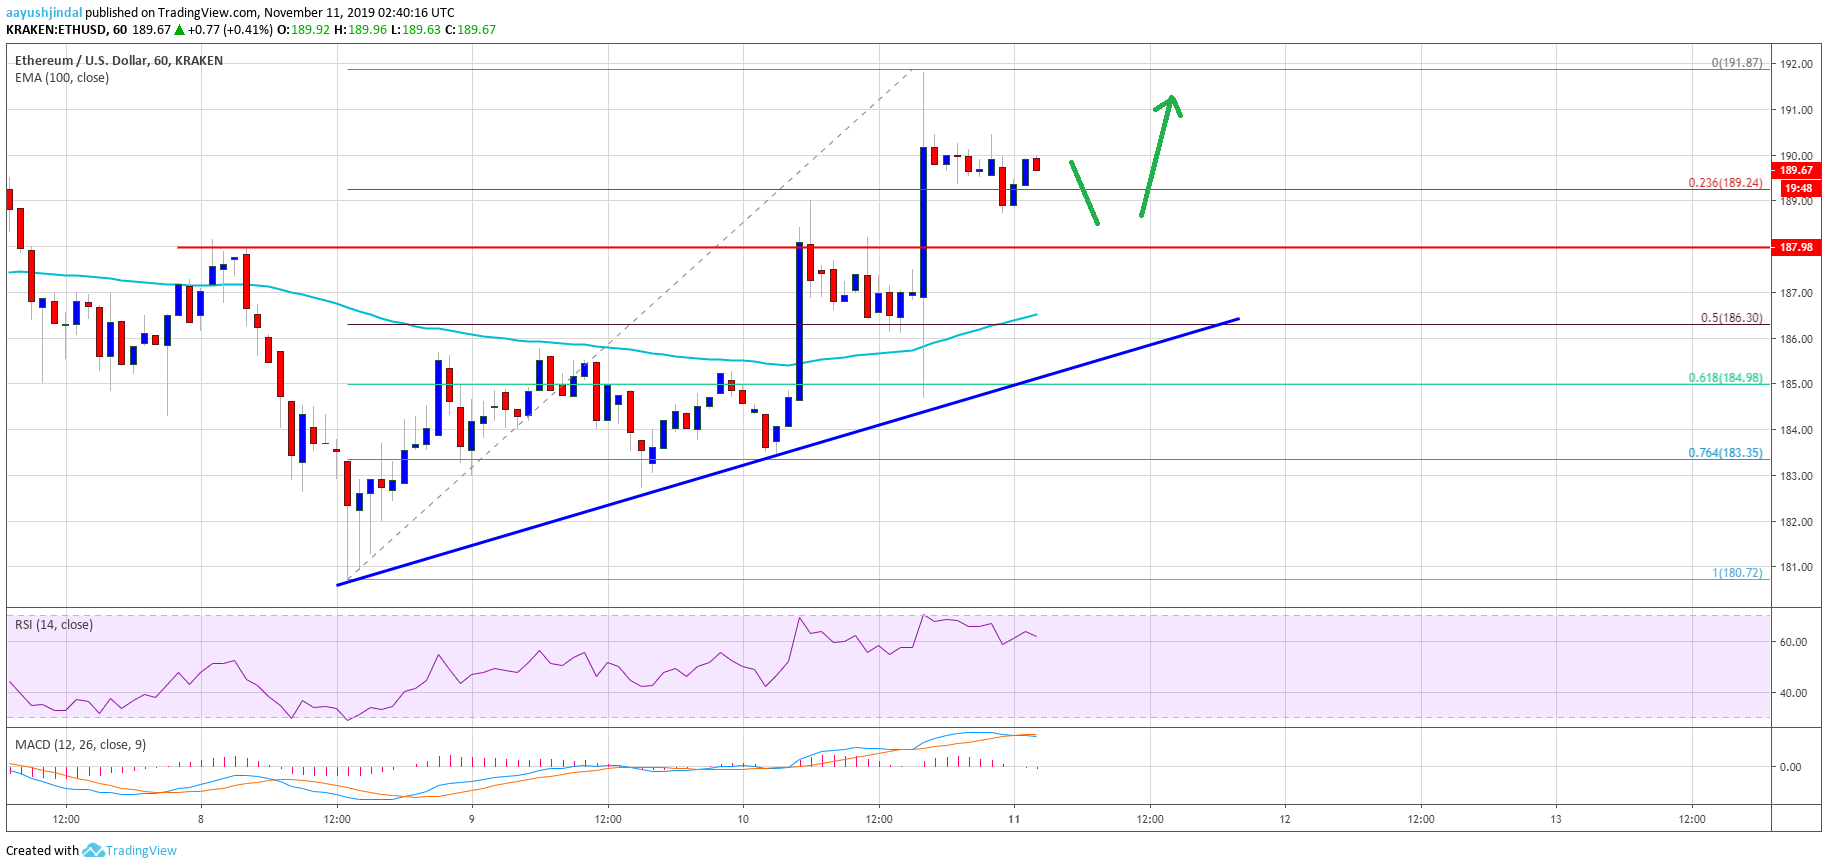
- There is a key bullish trend line forming with support near $186 on the hourly chart of ETH/USD (data feed via Kraken).
- Bitcoin is gaining momentum, but it is now trading near a crucial resistance at $9,100 (as discussed in the weekly forecast).
Ethereum price is recovering nicely above $188 versus the US Dollar, similar to bitcoin. ETH price might recover further towards $195 in the near term.
Ethereum Price Analysis
After a steady decline, Ethereum found support near the $180 level against the US Dollar. A decent support base was formed and ETH price started an upside correction above $182 (as discussed in the weekly forecast).
Moreover, there was a break above the key $186 and $188 resistance levels. The price even settled above the $186 pivot level and the 100 hourly simple moving average. It opened the doors for more gains above the $190 level.
A high was formed near $192 and the price is currently correcting lower. It is testing the 23.6% Fib retracement level of the recent wave from the $180 swing low to $192 high.
On the downside, there are many key supports for Ethereum near the $188 and $186 levels. Additionally, there is a key bullish trend line forming with support near $186 on the hourly chart of ETH/USD.
The 50% Fib retracement level of the recent wave from the $180 swing low to $192 high is also near the $186 level to provide support. Besides, the 100 hourly simple moving average is showing positive signs near the $186 level.
Therefore, the price remains well supported on the downside near the $188 and $186 levels. If the price fails to stay above the $186 support and the 100 hourly simple moving average, it could move back into a bearish zone.
On the upside, an immediate resistance is near the $192 level. However, the main resistance is near the $195 level, above which the price is likely to test the $200 resistance area in the near term.
Looking at the chart, Ethereum price is showing decent recovery signs above the $186 and $188 levels. Having said that, bitcoin is facing a strong resistance near $9,100. If BTC clears $9,100, there could be another upward move in ETH above the $192 and $195 resistance levels.
ETH Technical Indicators
Hourly MACD – The MACD for ETH/USD is slowly moving into the bearish zone.
Hourly RSI – The RSI for ETH/USD is currently well above the 50 level, with positive signs.
Major Support Level – $186
Major Resistance Level – $192


