
Reason to trust
How Our News is Made
Strict editorial policy that focuses on accuracy, relevance, and impartiality
Ad discliamer
Morbi pretium leo et nisl aliquam mollis. Quisque arcu lorem, ultricies quis pellentesque nec, ullamcorper eu odio.
Ethereum is stable above the $230 and $225 support levels against the US Dollar. ETH price seems to be eyeing a major bullish break above $238 and $240.
- Ethereum is currently attempting an upside break above $234 and the 100 hourly simple moving average.
- The price is likely to remain well bid above the $230 and $225 support levels.
- There is a key bullish flag pattern forming with resistance near $234 on the hourly chart of ETH/USD (data feed via Kraken).
- The pair could start a steady rise if it clears the $238 and $240 resistance levels.
Ethereum Price Holding Key Supports
After a failed attempt to clear the $238 resistance, Ethereum price extended its decline against the US Dollar. ETH broke the $232 and $230 support levels, and settled below the 100 hourly simple moving average.
There was a break below the 23.6% Fib retracement level of the upward move from the $218 low to $237 high. However, the decline was protected by the $228 support zone.
A low was formed near $228 and it seems like the 50% Fib retracement level of the upward move from the $218 low to $237 high acted as a strong support. Ether price is currently rising and trading above $230.
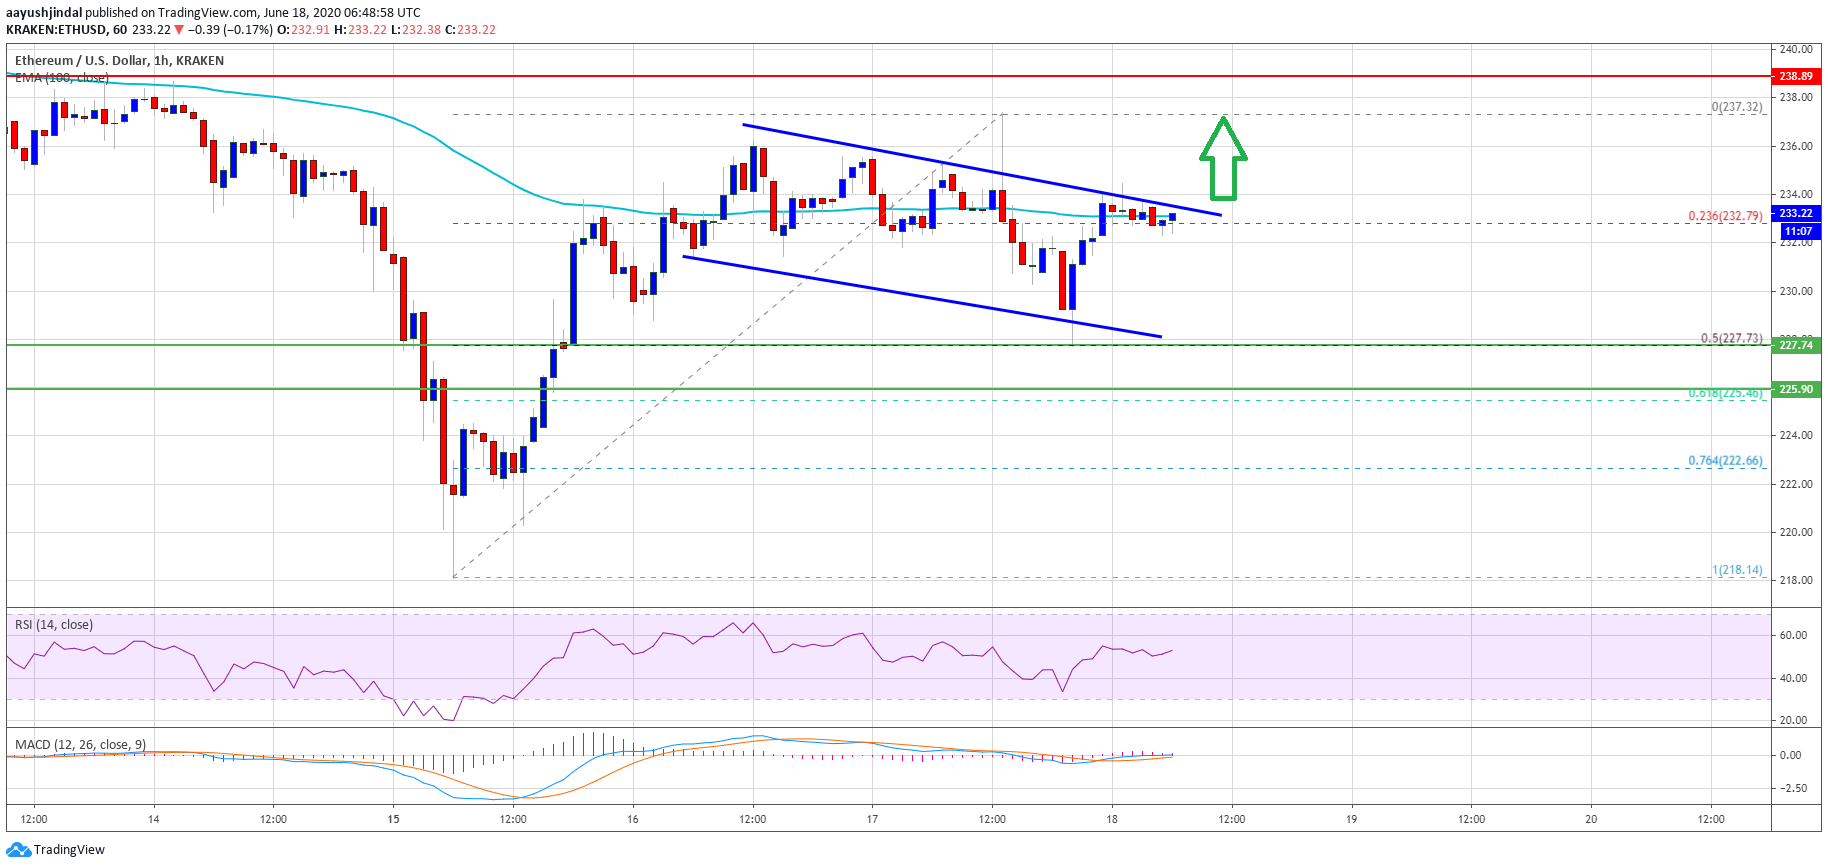
It is currently attempting an upside break above $234 and the 100 hourly simple moving average. There is also a key bullish flag pattern forming with resistance near $234 on the hourly chart of ETH/USD. An upside break above the channel resistance at $234 and a close above the 100 hourly simple moving average could open the doors for a test of $238 or $240.
To continue higher, the price must settle above the $240 resistance. In this scenario, the price could continue higher towards the $250 and $255 levels.
Fresh Bearish Wave in ETH?
If Ethereum continues to struggle near the $238 resistance or $240, it could decline again. An initial support is near the $230 level. The main support is now near the $225 level.
A clear break below the $225 support may perhaps decrease the chances of a bullish break above $240 in the coming sessions. The next support is at $218, followed by $215.
Technical Indicators
Hourly MACD – The MACD for ETH/USD is slowly moving in the bullish zone.
Hourly RSI – The RSI for ETH/USD is now just above the 50 level, with a bullish angle.
Major Support Level – $230
Major Resistance Level – $238
Take advantage of the trading opportunities with Plus500
Risk disclaimer: 76.4% of retail CFD accounts lose money.


