
Reason to trust
How Our News is Made
Strict editorial policy that focuses on accuracy, relevance, and impartiality
Ad discliamer
Morbi pretium leo et nisl aliquam mollis. Quisque arcu lorem, ultricies quis pellentesque nec, ullamcorper eu odio.
Ethereum started a fresh decline from the $245 resistance against the US Dollar. ETH price is currently correcting higher, but upsides are likely to remain capped near $238 and $240.
- ETH price is facing a strong resistance near $240 and the 100 simple moving average (4-hours) against the US Dollar.
- The bears are likely to remain in control as long as the price is below $240.
- There is a key connecting bearish trend line forming with resistance near $240 on the 4-hours chart of ETH/USD (data feed via Kraken).
- The pair could continue to move down towards the $225 and $220 levels in the near term.
Ethereum Price Could Struggle Near $240
This past week, Ethereum extended its decline below the $240 and $238 support levels against the US Dollar. ETH price even settled below the $236 level and the 100 simple moving average (4-hours).
Ether traded as low as $230 and it is currently correcting higher. It broke the $232 level, plus the 23.6% Fib retracement level of the recent decline from the $245 high to $230 swing low.
However, the price facing a strong resistance near $240 and the 100 simple moving average (4-hours). There is also a key connecting bearish trend line forming with resistance near $240 on the 4-hours chart of ETH/USD.
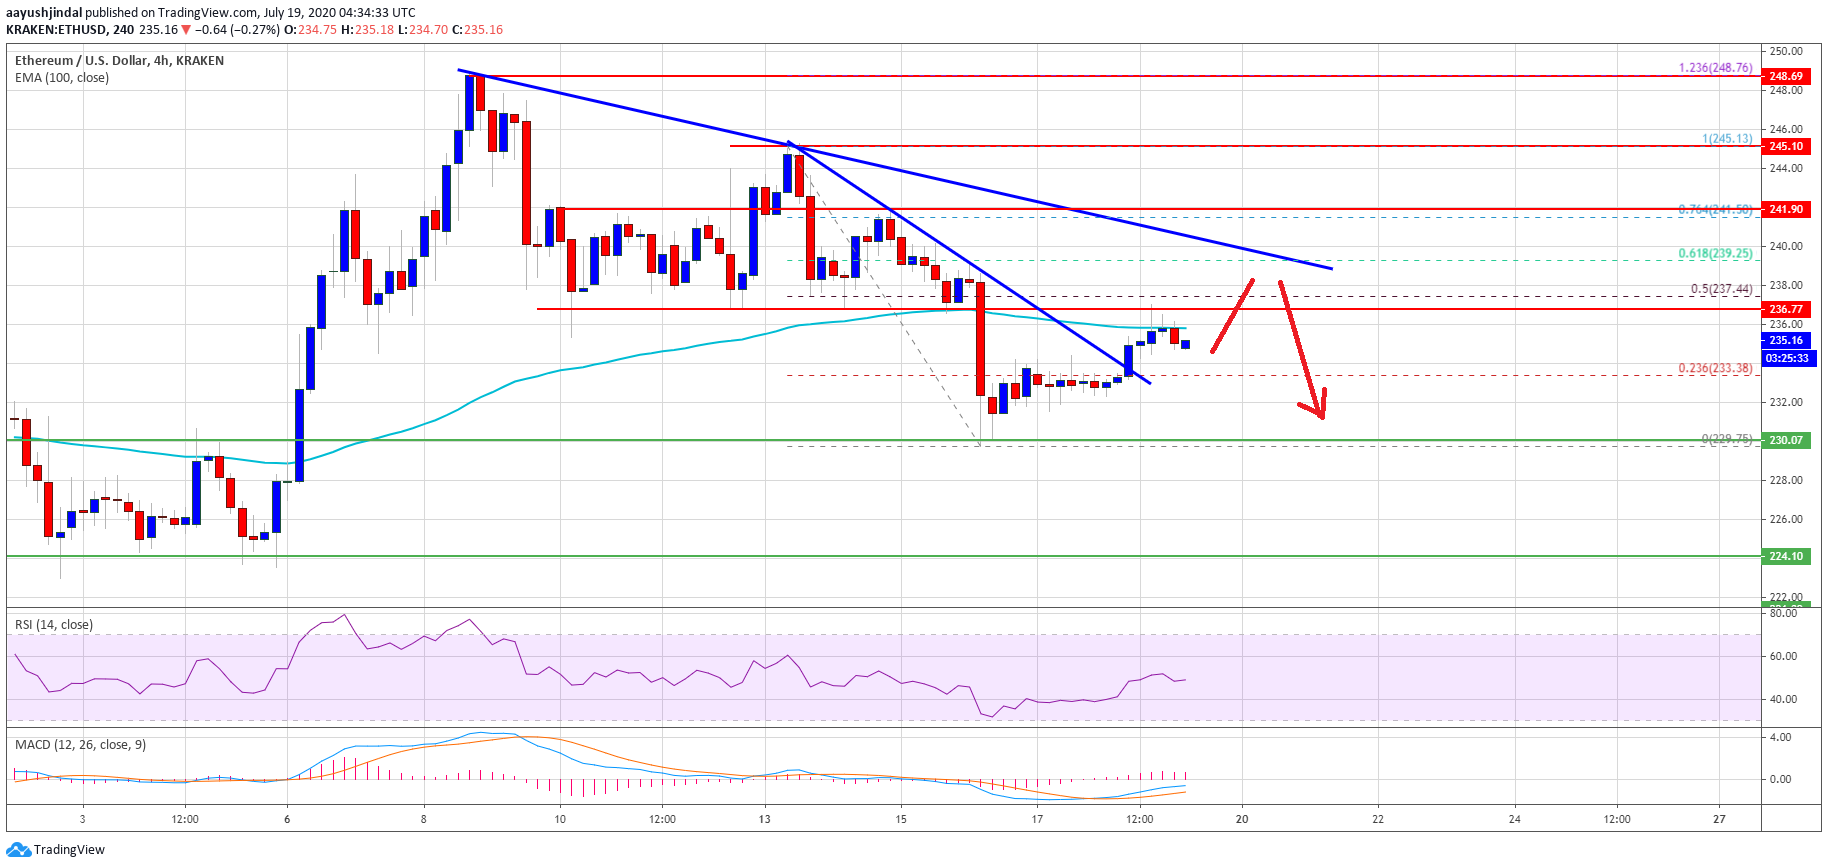
Ethereum price trades below $235. Source: TradingView.com
The 100 SMA is close to the 50% Fib retracement level of the recent decline from the $245 high to $230 swing low. Therefore, an upside break above the $236 and $240 levels won’t be easy. If the bulls succeed, the price could move into a bullish zone above $240.
The next major resistance is near the $245 level, above which the bulls are likely to aim a larger upward move towards the $255 and $262 levels in the coming days.
More Losses in ETH?
If Ethereum fails to continue higher above the $236 and $240 resistance levels, there are chances of more losses. The first major support is near the $230 level.
The next major support is near the $224 level, below which the bears are likely to target a strong bearish break below the $220 support level.
Technical Indicators
4 hours MACD – The MACD for ETH/USD is losing momentum in the bullish zone.
4 hours RSI – The RSI for ETH/USD is currently just below the 50 level.
Major Support Level – $230
Major Resistance Level – $240
Take advantage of the trading opportunities with Plus500
Risk disclaimer: 76.4% of retail CFD accounts lose money.


