
Reason to trust
How Our News is Made
Strict editorial policy that focuses on accuracy, relevance, and impartiality
Ad discliamer
Morbi pretium leo et nisl aliquam mollis. Quisque arcu lorem, ultricies quis pellentesque nec, ullamcorper eu odio.
- ETH price trimmed most its recent gains and declined below the $121 support area against the US Dollar.
- There was a break below a connecting bullish trend line with support at $120 on the hourly chart of ETH/USD (data feed via Kraken).
- The pair still remains supported on the downside above the $113 and $114 levels.
Ethereum price declined against the US Dollar and bitcoin after the Constantinople hard fork was postponed. However, ETH/USD could bounce back as long as it is above $113.
Ethereum Price Analysis
Yesterday, we saw a solid upside break above $121 and $124 in ETH price against the US Dollar. The ETH/USD pair even broke the $128 resistance and later spiked above the $130 level. However, the upside move was capped by the $131-132 zone. It also represents the 50% Fib retracement level of the key drop from the $151 high to $113 low. More importantly, the drop was due to the delay announcement of the Constantinople hard fork. The market reacted to the downside and the price dropped below $124.
Sellers gained traction and pushed the price below the 61.8% Fib retracement level of the recent wave from the $116 swing low to $132 swing high. More importantly, there was a break below a connecting bullish trend line with support at $120 on the hourly chart of ETH/USD. The pair settled below the $124 level and the 100 hourly simple moving average. The current price action is bearish below the $121 pivot level and the 76.4% Fib retracement level of the recent wave. On the downside, there are a few important supports near $114 and $113.
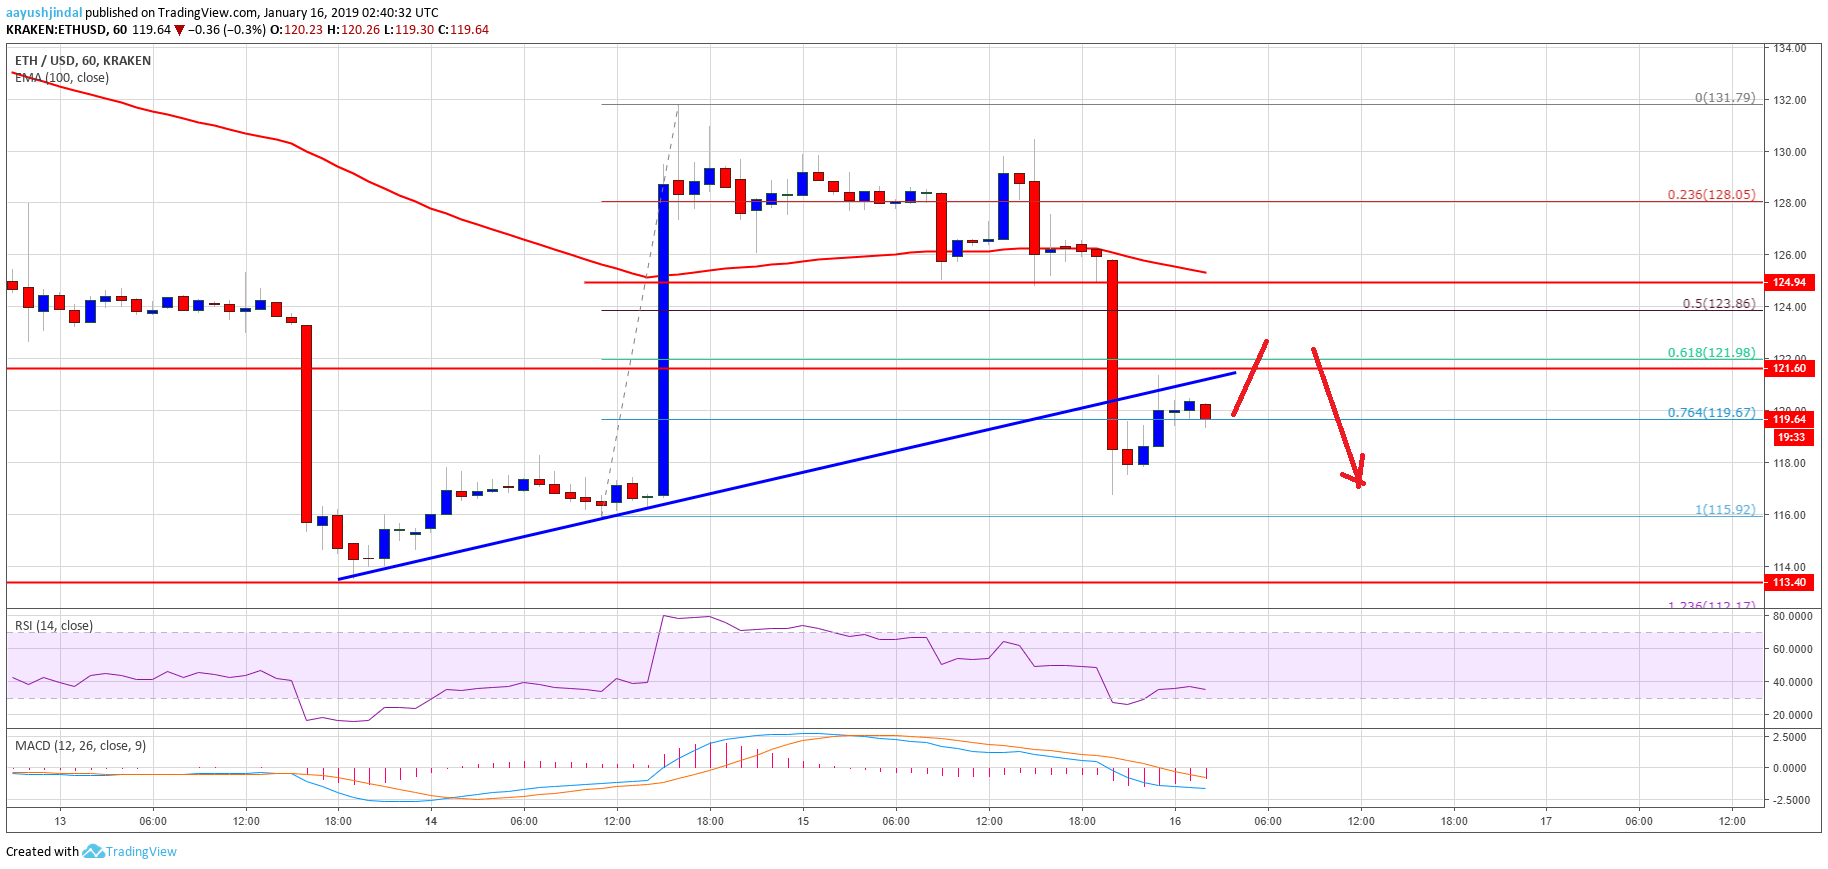
Looking at the chart, ETH price may correct a few points, but it is likely to revisit the $113 support area before a fresh bullish wave. On the upside, a break above the $121 and $124 levels is needed for a decent upward move.
ETH Technical Indicators
Hourly MACD – The MACD for ETH/USD is currently in the bearish wave, but it’s losing momentum.
Hourly RSI – The RSI for ETH/USD is currently well below the 50 level, with a slight bearish angle.
Major Support Level – $113
Major Resistance Level – $124


