
Reason to trust
How Our News is Made
Strict editorial policy that focuses on accuracy, relevance, and impartiality
Ad discliamer
Morbi pretium leo et nisl aliquam mollis. Quisque arcu lorem, ultricies quis pellentesque nec, ullamcorper eu odio.
Key Highlights
- ETH price failed to stay above the $202 support and declined recently against the US Dollar.
- Yesterday’s highlighted important bullish trend line was breached with support at $202 on the hourly chart of ETH/USD (data feed via Kraken).
- The pair is currently under pressure below $202 and it could extend its slide in the near term.
Ethereum price broke key support levels against the US Dollar and bitcoin. ETH/USD may decline in the short term towards $198 or $196.
Ethereum Price Analysis
Yesterday, we saw a short term top near the $207 level in ETH price against the US Dollar. The ETH/USD pair started a downside correction and traded below the $205 level. Later, sellers gained traction and pushed the price below the $202 support. Moreover, there was a break below the 100 hourly simple moving average, which is currently at $202.
During the drop, the price moved below the 50% Fib retracement level of the last wave from the $196 low to $207 swing high. More importantly, yesterday’s highlighted important bullish trend line was breached with support at $202 on the hourly chart of ETH/USD. The pair is currently consolidating near the $200 level with a bearish angle. An immediate support is the 61.8% Fib retracement level of the last wave from the $196 low to $207 swing high and $200. Below $200, the price could extend the decline towards the $198 or $196 levels. On the upside, there is a connecting bearish trend line formed with resistance at $202.
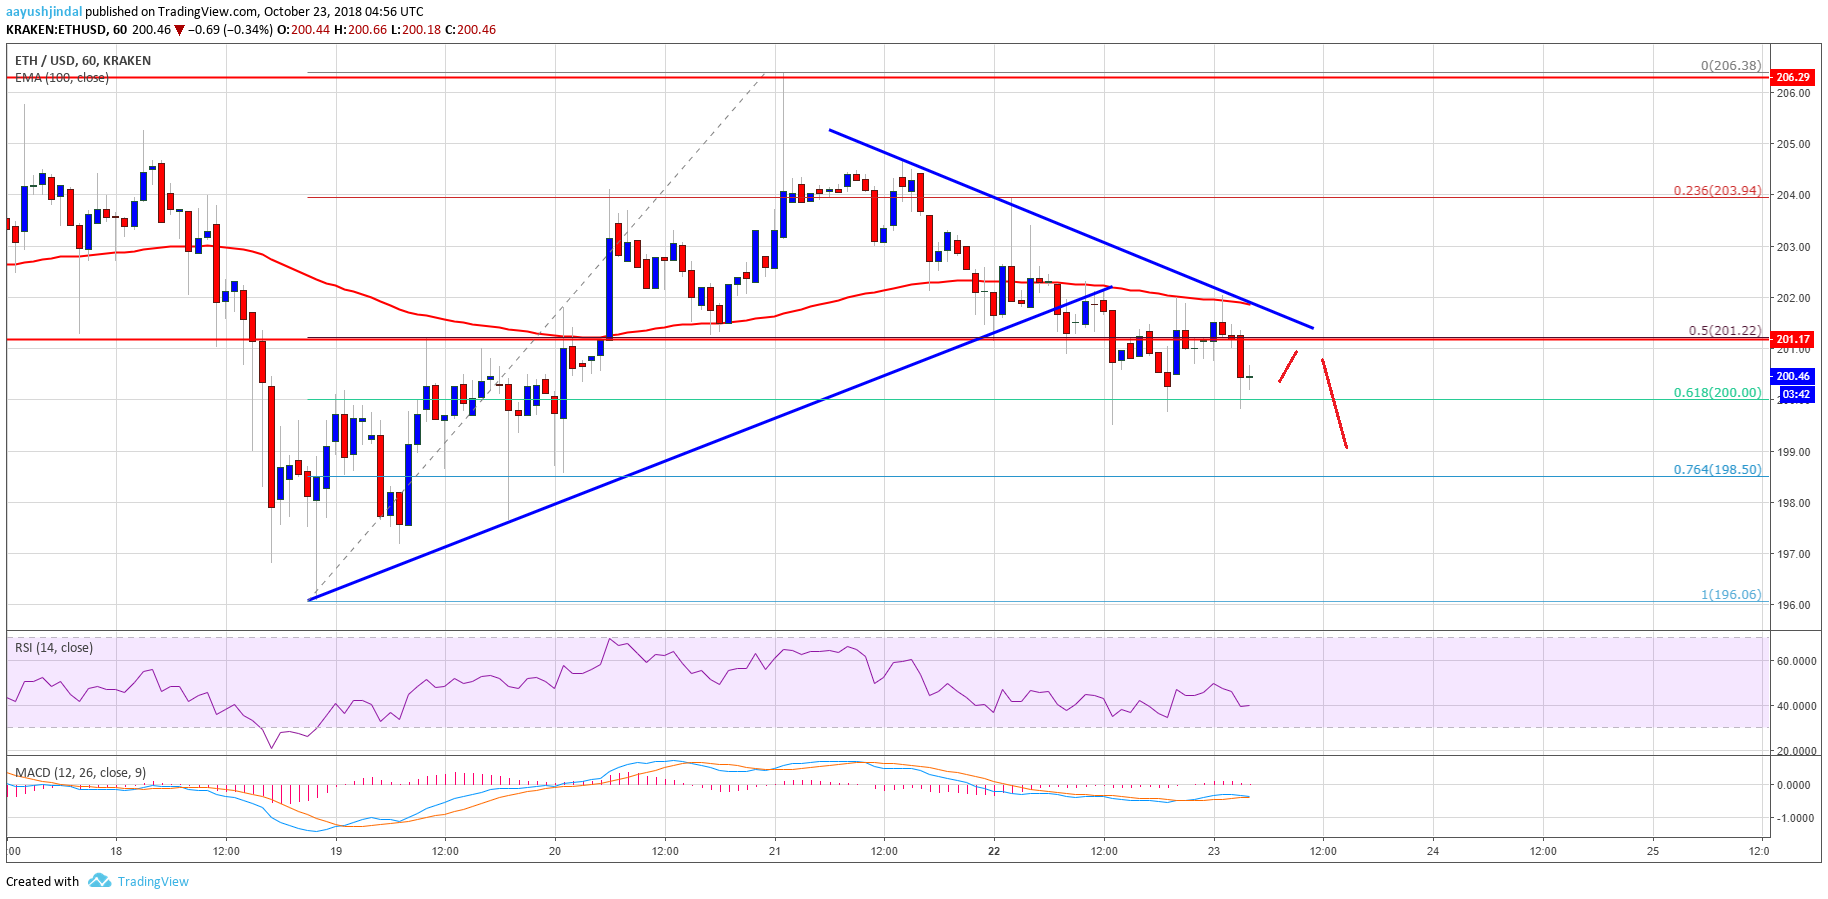
Looking at the chart, ETH price could face a strong resistance near the trend line, $202, and the 100 hourly SMA. Therefore, a break above $202 is needed for buyers to regain control in the short term. The next resistance on the upside is near the $205 level, followed by $207.
Hourly MACD – The MACD is about to move into the bearish zone.
Hourly RSI – The RSI is currently near the 40 level.
Major Support Level – $198
Major Resistance Level – $202