
Reason to trust
How Our News is Made
Strict editorial policy that focuses on accuracy, relevance, and impartiality
Ad discliamer
Morbi pretium leo et nisl aliquam mollis. Quisque arcu lorem, ultricies quis pellentesque nec, ullamcorper eu odio.
- ETH price failed to move past the $105 resistance and later declined against the US Dollar.
- Yesterday’s highlighted crucial bearish trend line is intact with resistance near $104 on the hourly chart of ETH/USD (data feed via Kraken).
- The pair must break the $104 and $105 resistance levels to start a decent upside correction.
Ethereum price recovery remained capped against the US Dollar and bitcoin. ETH/USD may continue to consolidate above the $100 support before the next key break.
Ethereum Price Analysis
Yesterday, there was a short term upside correction from the $100 swing low in ETH price against the US Dollar. The ETH/USD pair traded above the $102 and $104 resistance levels. However, the price failed near a major resistance area at $105 and the 100 hourly simple moving average. Moreover, there was a failure observed near the 61.8% Fib retracement level of the last drop from the $107 high to $100 low. The price topped near the $105 level and later started a downside move.
It broke the $104 level and the 23.6% Fib retracement level of the recent wave from the $100 swing low to $105 swing high. On the downside, there are a few supports near the $103 level. If the price continues to move down, it could test the $102 level. It represents the 61.8% Fib retracement level of the recent wave from the $100 swing low to $105 swing high. The main support is at $100, below which there is a risk of a sharp drop towards the $95 support. On the upside, there are many hurdles near the $104 and $105 resistance levels. Additionally, yesterday’s highlighted crucial bearish trend line is intact with resistance near $104 on the hourly chart of ETH/USD.
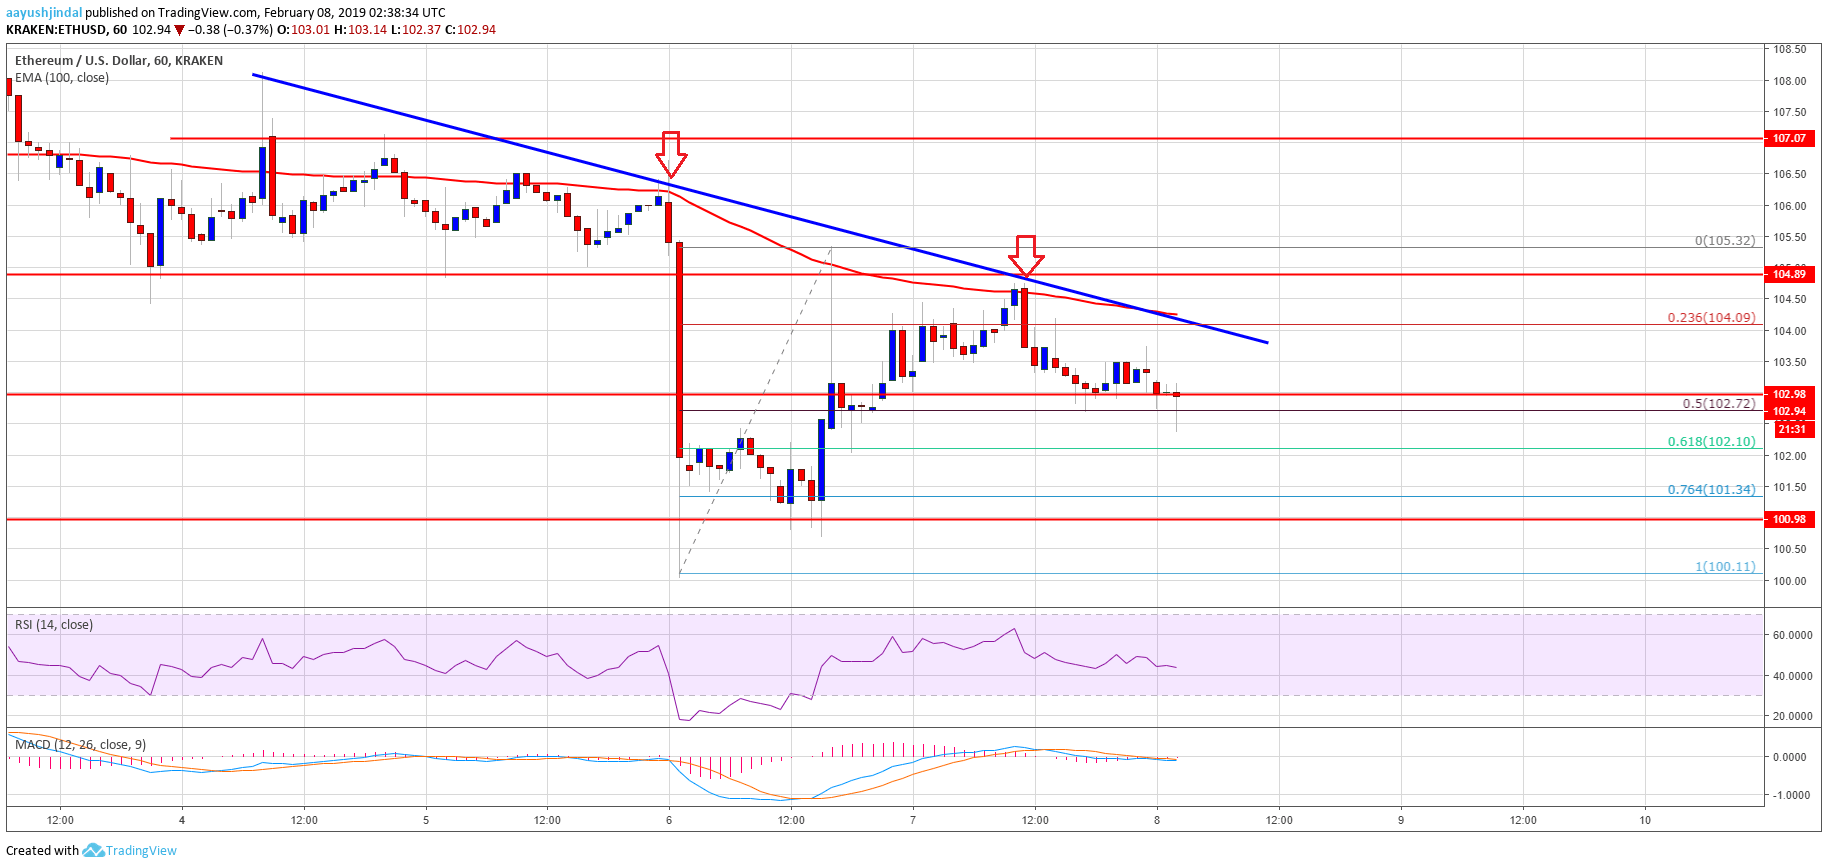
Looking at the chart, ETH price remains below the key $104 and $105 resistance levels. If buyers continue to struggle near the $105 level, there could be a downside reaction below the $100 support.
ETH Technical Indicators
Hourly MACD – The MACD for ETH/USD is slowly moving back in the bearish zone.
Hourly RSI – The RSI for ETH/USD is back below the 50 level, with a bearish angle.
Major Support Level – $100
Major Resistance Level – $105


