Key Highlights
- Ethereum price continued to consolidate in a tiny range, and waiting for a catalyst for a break in the short term.
- As highlighted yesterday, a contracting triangle pattern formed on the hourly chart (data feed via Kraken) is still in play and may act as a catalyst for the next move.
- The price is above the 100 hourly simple moving average, which is a positive sign for the bulls.
Ethereum price is consolidating inside a contracting triangle. A break either higher or lower may ignite a solid move in the near term.
Ethereum Price – Buy or Sell?
Ethereum price after gains started a consolidation pattern, and it looks like it may continue to trade in a range for some time moving ahead. There is a contracting triangle pattern is formed on the hourly chart (data feed via Kraken), as highlighted in yesterday’s post. It may act as a catalyst for the next move if all goes well within the upcoming days.
If we go by the number of attempts, then the number of tests of the triangle support are more compared with the triangle resistance. One positive point to note for the bulls is the fact that the price is currently above the 100 hourly simple moving average (data feed via Kraken). On the downside, the 61.8% Fib retracement level of the last wave from the $5.99 low to $6.49 high may also act as a minor support. A break below it may call for a test of the triangle support area.
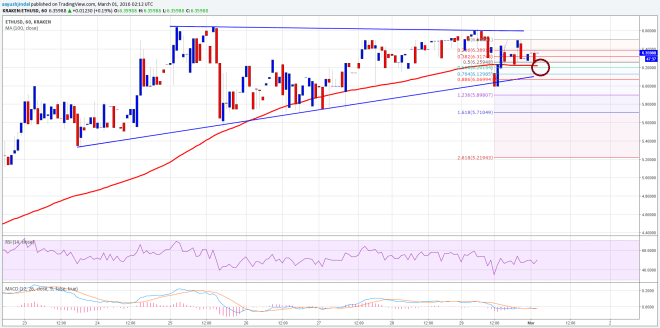

If the bearish pressure increases, and the price closes below the 100 MA and the 88.6% Fib retracement level of the last wave from the $5.99 low to $6.49 high, then a break down is possible.
Hourly MACD – The MACD may change the slope to the bullish area, calling for a few positives.
Hourly RSI – The RSI is just below the 50 level, and the bulls need to break above it for more gains.
Intraday Support Level – $6.10
Intraday Resistance Level – $6.50-60
Charts courtesy of Kraken via Trading View