Key Highlights
- Ethereum price spiked higher and the recently highlighted breakout pattern on the hourly chart played well.
- There was a contracting triangle pattern formed on the hourly chart (data feed via Kraken), which was broken by the bulls to take the price higher.
- The price traded above the $7.50 level, and may correct a few points from the current levels moving ahead.
Ethereum price gained heavily once again and it looks like there is a chance of more upsides if the bulls remain in control.
Ethereum Price – Buy Dips?
Ethereum price consolidated for a brief period during the past couple of sessions, and finally broke higher. I highlighted a contracting triangle pattern on the hourly chart (data feed via Kraken) yesterday and suggested to wait for a break to enter a trade. The price did move higher and breached a major resistance area of $6.60. After the break, there was a nice upside move that took the price above the $7.0 level.
A new high was formed at $7.75 where sellers are trying their best to prevent additional gains. So, there is a chance of a minor correction in the short term. An initial support can be around the 23.6% Fib retracement level of the last wave from the $6.30 low to $7.75 high. It looks like the price is in the overbought territory so the bulls must be very careful in the short term and should wait for the right time to enter a trade.
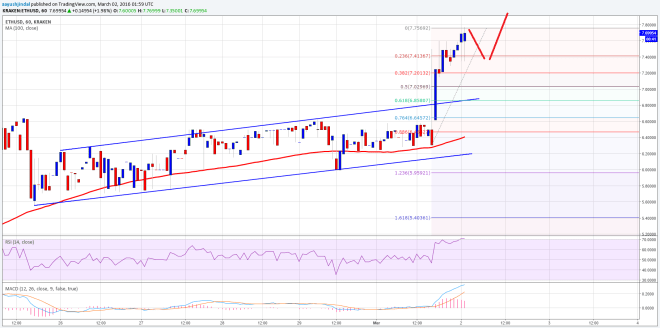

The price is well above the 100 hourly simple moving average (data feed via Kraken), which is a positive sign. The most important support on the downside can be at the 50% Fib retracement level of the last wave from the $6.30 low to $7.75 high.
Hourly MACD – The MACD may change the slope to the bearish zone, suggesting the price is exhausted.
Hourly RSI – The RSI is around the overbought levels, calling for a minor correction.
Intraday Support Level – $7.10
Intraday Resistance Level – $7.75
Charts courtesy of Kraken via Trading View