Key Highlights
- Ethereum price continued to gain traction, and our buying dips idea worked very well intraday.
- There was a new high set for Ethereum price, as it traded close to the $10 handle.
- There is now a bullish trend line formed on the hourly chart (data feed via Kraken), which may act as a catalyst for the price moving ahead.
Ethereum price surged higher and created a new high above $9.5. Let’s see whether it can rise further in the near term.
Ethereum Price – Continue Buying?
Ethereum price rocketed higher during the past two days. Both days we were looking to buy Ethereums and our plan worked perfectly. First, we were looking to buy with a break, and then yesterday, I suggested to buy dips. The price did correct a few points down yesterday, and then found buyers. There was a sharp upside reaction after the correction was completed.
The price climbed higher and even traded close to the $10 handle. A new high of $9.88 was set (data feed via Kraken). The price is again moving down and correcting. There is a bullish trend line formed on the hourly chart (data feed via Kraken), which is prevented a downside break and acting as a support. The 61.8% Fib retracement level of the last wave from the $7.51 low to $9.88 high is already tested.
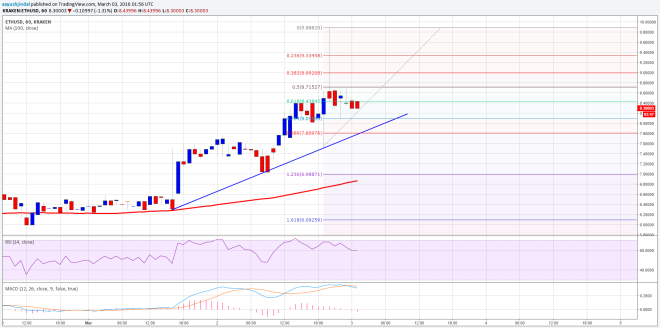

However, the price is showing some signs of weakness, but as long as the price is above the highlighted trend line and support area there is a chance of one more upside move. A below the trend line support area could take the price towards the 1.236 extension of the last wave from the $7.51 low to $9.88 high.
Hourly MACD – The MACD is in the bearish slope, calling for more weakness.
Hourly RSI – The RSI is around the overbought levels, suggesting a short-term correction.
Intraday Support Level – $7.80
Intraday Resistance Level – $9.00
Charts courtesy of Kraken via Trading View