Key Highlights
- There was no stopping Ethereum price, as it moved higher and almost tested the $10 levels.
- A new high of $9.94 is formed, and the price is currently consolidating gains.
- There is a bullish trend line formed on the hourly chart (data feed via Kraken), which holds a lot of importance for the bulls in the near term.
Ethereum price is all bullish, and may gain further. However, there is a bullish trend line support forming, which might play a crucial role.
Ethereum Price – Trend Line Support
Ethereum price surged higher to trade as high as $9.94, and was just a few points shy of testing the most important level – $10. Sellers appeared and paused the upside move. The price is currently consolidating gains, and there is a bullish trend line formed on the hourly chart (data feed via Kraken).
The highlighted trend line support may play a major role for both the bulls and sellers. As long as the price is above the trend line support area, there is a chance of further moves. On the other hand, if sellers manage to break it, then a correction might happen. The price is currently trading near the 23.6% Fib retracement level of the last wave from the $6.28 low to $9.94 high. An hourly close below it may increase the bearish pressure moving ahead.
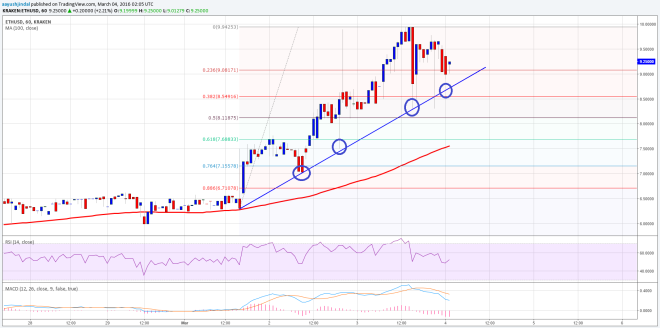

After the trend line break, the most important support may be around the 100 simple moving average (hourly, data feed via Kraken) since it is coinciding with the 61.8% Fib retracement level of the last wave from the $6.28 low to $9.94 high. On the upside, a break above the recent high of $9.94 may call for a test of $10.
Hourly MACD – The MACD is in the bearish slope, and showing no signs of strength.
Hourly RSI – The RSI is just below the 50 level, which is a warning to the bulls.
Intraday Support Level – $9.00
Intraday Resistance Level – $10.0
Charts courtesy of Kraken via Trading View