Key Highlights
- Ethereum price continued to trade higher against the US Dollar, and posted yet another break.
- Yesterday’s idea of buying dips in the ETH/USD pair worked, as it moved higher.
- There is a bullish trend line formed on the hourly chart (data feed via Kraken) of ETH/USD, which can be considered as a support area on the downside.
Ethereum price showed more positive signs, and traded higher. Can it continue to trade higher and can we buy more?
Ethereum Price Buy
Ethereum price ETH regained traction against the US Dollar, as there were more upsides noted. The price broke a couple of key resistance levels to trade near $11.60. My yesterday’s idea of buying dips in the short term worked, as the price moved higher. At this moment, the price is comfortably placed in the bullish area, which means it may continue to move higher.
On the downside, there is a bullish trend line formed on the hourly chart (data feed via Kraken) of ETH/USD, which may act as a major support area if the price moves down. An initial support on the downside is around the 23.6% Fib retracement level of the last wave from the $10.08 low to $11.52 high.
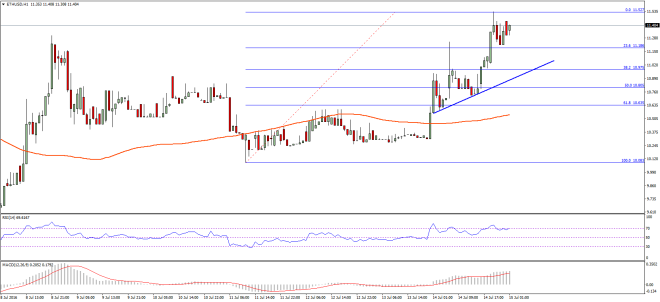

The price is also well above the 100 hourly simple moving average, suggesting the bulls are in control. We need to see whether ETH/USD can break the $11.52 level or not without correcting towards the 38.2% Fib retracement level of the last wave from the $10.08 low to $11.52 high. Overall, one may consider buying dips in the short term, as long as it is above the $11.00 support area.
Hourly MACD – The MACD is in the bullish zone, which is a positive sign for the bulls.
Hourly RSI – The RSI is around the 70 levels, suggesting the bears failed to defend the upside.
Major Support Level – $11.00
Major Resistance Level – $11.60
Charts courtesy – SimpleFX