Key Highlights
- There was a nasty decline in ETH price yesterday, as it dipped towards $70 against the US Dollar.
- There was a decent recovery from $70, and now two bearish trend lines at $88 on the hourly chart (ETH/USD, data feed via SimpleFX) are acting as a resistance.
- The price may dip once again towards $80 before gaining bids for an upside move.
Ethereum price dipped sharply intraday against the US Dollar and Bitcoin, and now the current recovery in ETH/USD is facing a major hurdle near $88.
Ethereum Price Major Resistance
Yesterday, we were looking for a slight increase in bearish pressure, as ETH price dipped below $85 against the US Dollar. Later, the price extended its downside move, and weakened by more than $10. A decline was initiated from $85 to $70, as the price traded as low as $69.20. Before that, there was a failure to break the 76.4% Fib retracement level of the last wave from the $85.10 low to $97.70 high. It resulted in a sharp decline, and the price even broke the $80 swing low.
Thankfully, the price found support near $70 and started a recovery. It has already moved above the 50% Fib retracement level of the last decline from the $97.90 high to $69.24 low. It is a positive sign, but the price is currently struggling near $88. There are two bearish trend lines at $88 on the hourly chart of ETH/USD, which are acting as a resistance.
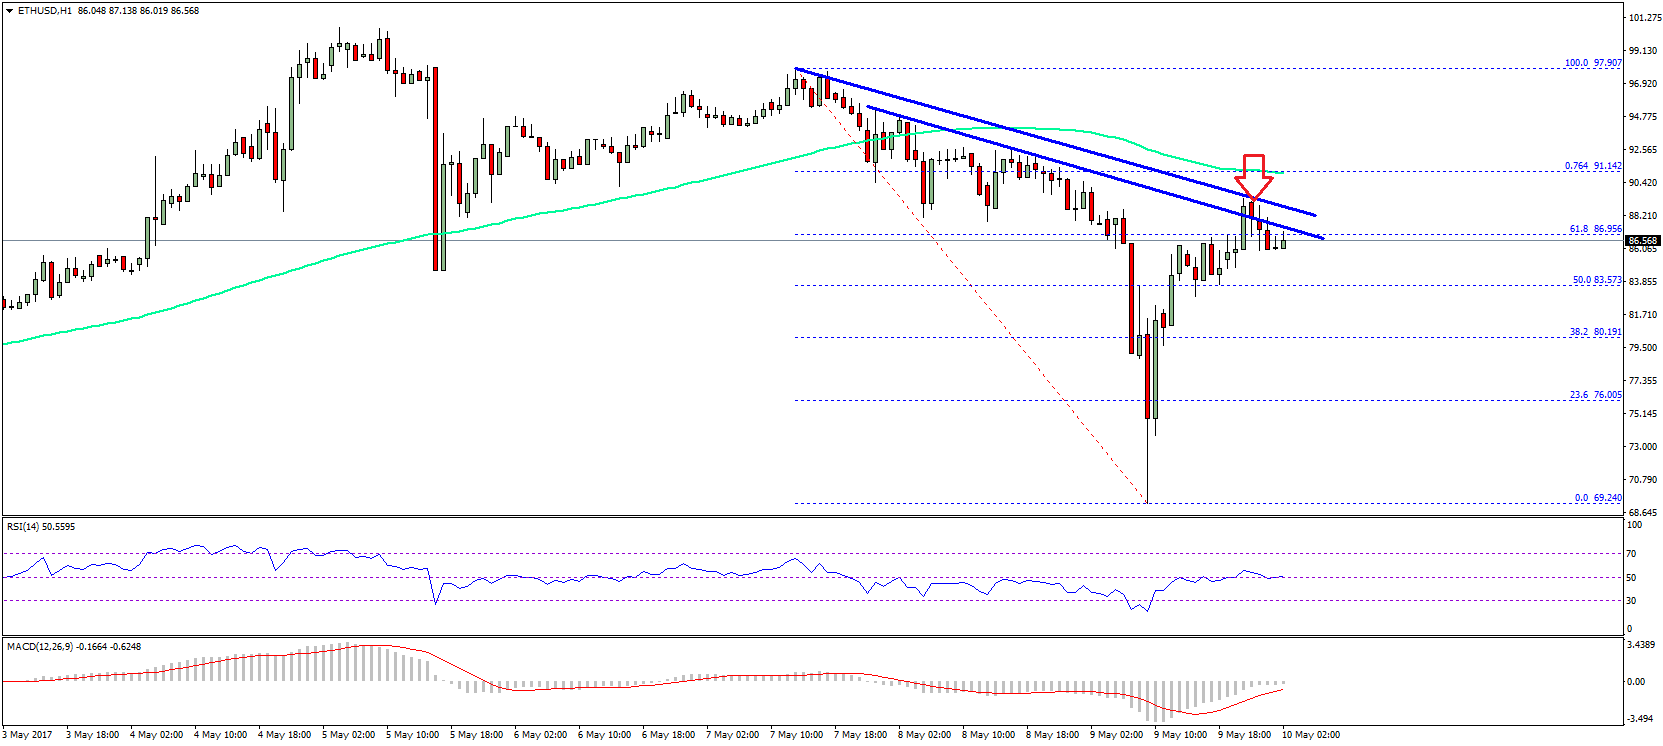
We can also say that the price is struggling to close above $90. Above 90, the 100 hourly simple moving average at $91.20 is also waiting to act as a barrier. So, I guess there can be another dip before the price bounces above $90.
Hourly MACD – The MACD is about to move from the bearish to bullish zone.
Hourly RSI – The RSI is currently just around the 52 level.
Major Support Level – $80
Major Resistance Level – $90
Charts courtesy – SimpleFX