Key Highlights
- ETH price remained supported above $51.10 against the US Dollar, but was seen struggling near $53.50.
- There is a new bullish trend line with support at $51.10 formed on the hourly chart (ETH/USD, data feed via SimpleFX).
- A break above $53.50 might call for more upsides in the near term towards $55.
Ethereum price is facing a major resistance near $53.50 against the US Dollar. Can ETH/USD break it and move further higher?
Ethereum Price Resistance
There was a nice upside move yesterday in ETH price, as it moved above $51.00 against the US Dollar. The price is now positioned well, but it is struggling to break a monster resistance near $53.50. The same level acted as a hurdle on 3-4 occasions. So, it won’t be easy for buyers to break $53.50 and push the price higher. At the same time, if they succeed, the next level could be $55.00. During the past 24 hours, there are two failures already, and it’s a bad sign in the short term.
On the downside, an initial support is at 38.2% Fib retracement level of the last wave from the $47.50 low to $53.48 high. However, the most important support is near the 100 hourly simple moving average at $50.00. Above it, there is a new bullish trend line at $51.10 on the hourly chart (ETH/USD, data feed via SimpleFX). The same trend line also coincides with the 50% Fib retracement level of the last wave from the $47.50 low to $53.48 high. So, we can say there are two important support levels at $51.10 and $50.00.
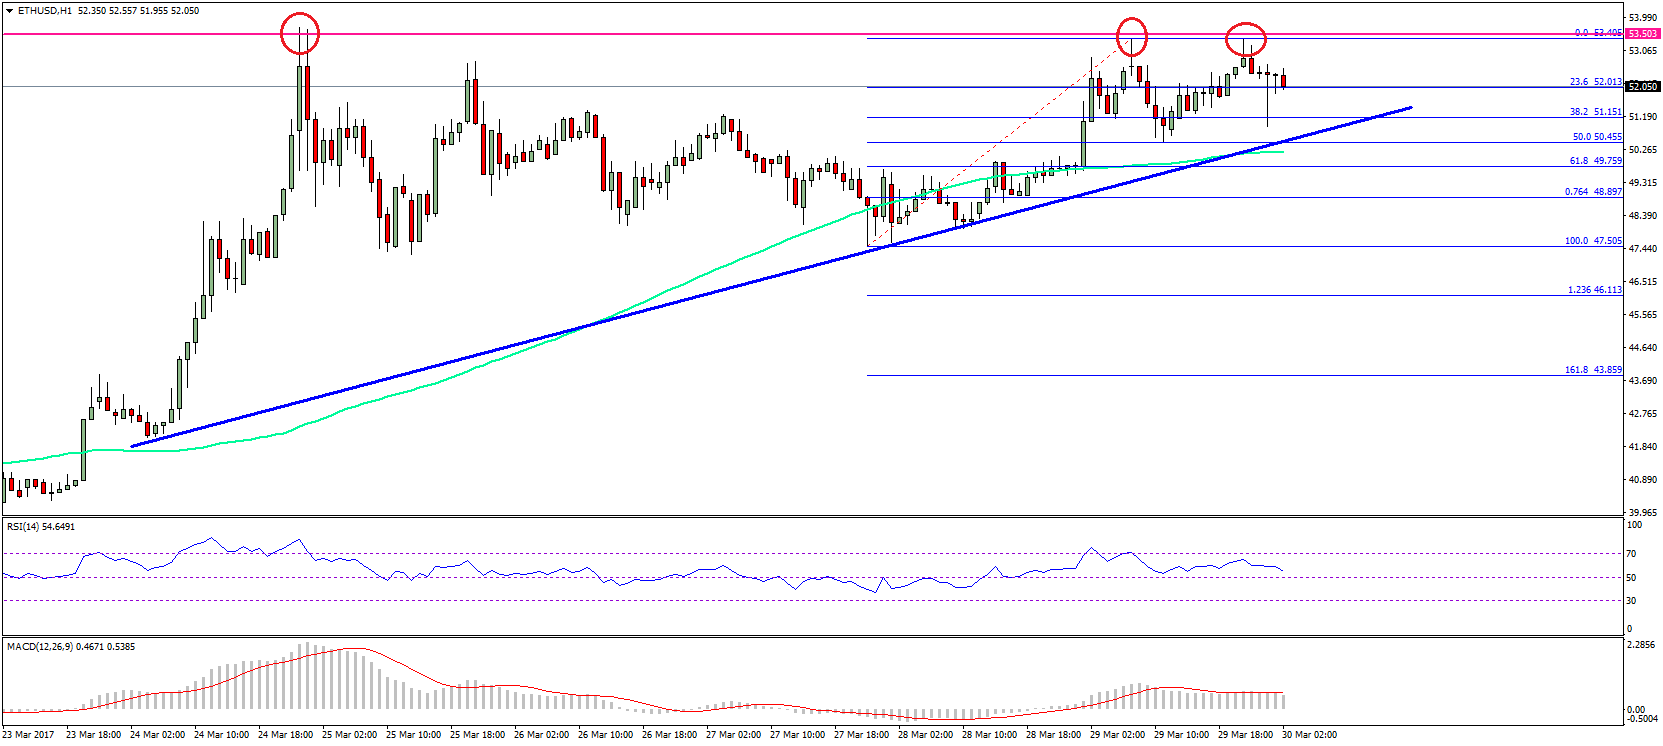
The trend line is ascending, which means there would be a break soon either above $53.50 or below $51.00.
Hourly MACD – The MACD is currently above the 50 level, which is a positive sign.
Hourly RSI – The RSI is slowly reducing the bullish slope.
Major Support Level – $51.10
Major Resistance Level – $53.50
Charts courtesy – SimpleFX