Key Highlights
- Ethereum price after posting a minor high around $14.38 vs the US Dollar found offers, and started consolidating gains.
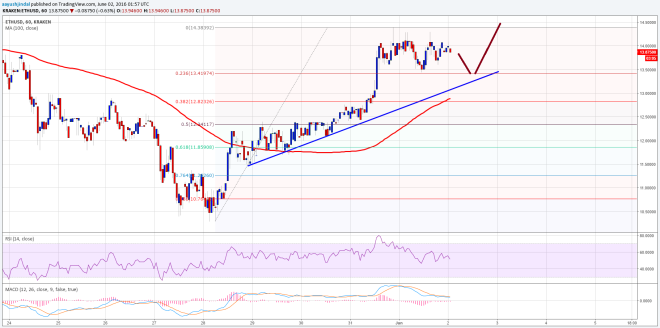
- Yesterday’s highlighted bullish trend line on the hourly chart (data feed via Kraken) of ETH/USD is still in the action and may act as a support area.
- The price may correct a few points down before it can find bids once again in the short term.
Ethereum price looks like setting up for a minor correction towards a major support area of $13.20 where it may find buyers.
Ethereum Price – $13.20 As Support
Ethereum price ETH may have made a short-term top near $14.38, and might trade lower vs the US Dollar moving ahead. Yesterday, I highlighted a bullish trend line on the hourly chart (data feed via Kraken) of ETH/USD, and mentioned that it might act as a support area. The highlighted trend line and support area is still in place and if the price moves down, it could play a major role for the bulls.
Moreover, on the downside, the 23.6% Fib retracement level of the last wave from the $10.30 low to $14.38 high can also be seen as a bid zone since it is coinciding with the trend line and support area. The best part is the fact that the 100 hourly simple moving average is aligned with the trend line, which means the $13.20 level represents a monster support area in the near term.

As long as the price is above the stated support area, there is a chance of it gaining traction once again and moving higher. Only a break below it could trigger more losses. So, if you are looking to enter a buy trade, then place a stop below it.
Hourly MACD – The MACD is in the bearish zone, calling for a minor correction.
Hourly RSI – The RSI is above the 50 level, signaling bullish signs.
Intraday Support Level – $13.20
Intraday Resistance Level – $14.20
Charts courtesy of Kraken via Trading View