Key Highlights
- Ethereum price after trading as high as $14.75 found sellers vs the US dollar, and currently trading down.
- There is a bullish trend line formed on the hourly chart (data feed via Kraken) of ETH/USD, which can be seen as a support zone if the price moves down.
- $14.00-10 area holds a lot of importance for the ETH buyers, and may continue to act as a pivot zone.
Ethereum price is currently correcting and may continue to move down. However, there is a major support on the downside, which can act as a barrier for sellers.
Ethereum Price Trend Line Support
Ethereum price ETH had a good start to this week vs the US Dollar, as it traded higher. However, after testing the $14.75-80 resistance area, it started struggling. The price is currently under a correction phase, and may correct further in the short term.
However, there are many important support levels, which may come into play and act as a buy zone. The most critical one is around the $14.00 area, as there is a bullish trend line formed on the hourly chart (data feed via Kraken) of ETH/USD. Currently, the price is testing the 23.6% Fib retracement level of the last leg from the $13.00 low to $14.75 high, which is acting as a short-term support.
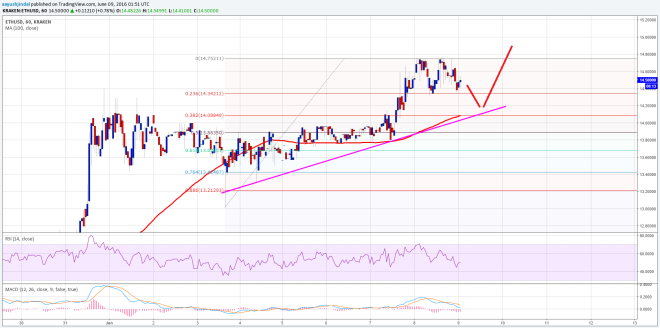

However, the 38.2% Fib retracement level of the last leg from the $13.00 low to $14.75 high holds the key, as it is positioned with the 100 hourly simple moving average. So, one may consider buying near it as long as the 100 hourly SMA holds.
Hourly MACD – The MACD is in the bearish zone, which means the highlighted correction scenario may be valid.
Hourly RSI – The RSI is also below the 50 level, which is another sign of a correction in ETH moving ahead.
Intraday Support Level – $14.00
Intraday Resistance Level – $14.75
Charts courtesy of Kraken via Trading View