Key Highlights
- ETH price remained in a range, and there was no major move against the US Dollar.
- There is a bullish trend line formed on the hourly chart (data feed via SimpleFX) of ETH/USD, which is currently acting as a support.
- The price remains at a risk of a break in the short term if the buyers keep failing.
Ethereum price failed to make any major move versus the US Dollar, and remained in a range to post no new low or high.
Ethereum Price Range
Ethereum price recently traded near $11.91 where sellers appeared and pushed the price down versus the US Dollar. The ETH/USD pair is currently trading lower and moved below the 100 hourly simple moving average. However, there may be no break, as there is a bullish trend line formed on the hourly chart (data feed via SimpleFX) of ETH/USD. It may act as a support on the downside, and prevent any major losses in the short term.
The same trend line act as a buy zone earlier, and helped the pair in forming a 3-wave structure. The pair may be completing the mentioned wave structure soon, which may help the price in gaining traction. However, it may fail as well, as there were only swing moves, and the price remained muted most of the time. There is basically a range pattern formed with resistance around $12.00-10, and support near $11.60.
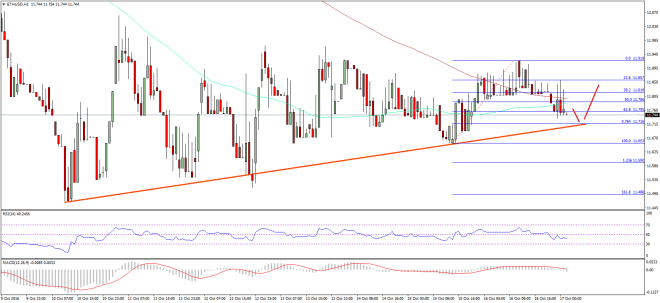

In the current wave, the trend line is also positioned with the 76.4% Fib retracement level of the last wave from the $1165 low to $11.91. So, the chances of a new low are very less, and the trend line may produce a bounce moving ahead.
Hourly MACD – The MACD is almost flat with no major momentum either higher or lower.
Hourly RSI – The RSI has just moved below the 50 level.
Major Support Level – $11.65
Major Resistance Level – $11.91
Charts courtesy – SimpleFX