

Key Highlights
- ETH price continues to face selling pressure below the $425 pivot level against the US Dollar.
- There are two key bearish trend lines forming with resistance around $420 on the hourly chart of ETH/USD (data feed via SimpleFX).
- The pair is currently under pressure and it is following a bearish path below $428.
Ethereum price faced a lot of selling pressure against the US Dollar and Bitcoin. ETH/USD is now below $410 and eyeing more declines.
Ethereum Price Resistance
It seems like there is no stopping sellers as ETH price declined below the $420 and $410 levels against the US Dollar. The price failed to correct substantially and faced heavy offers near $425. Moreover, the 38.2% Fib retracement level of the last drop from the $461 high to $410 also acted as a hurdle. A fresh downside wave was initiated and the price moved below the $410 support. A new low was formed at $397.30 and is currently correcting higher.
It moved above the 23.6% Fib retracement level of the last decline from the $460.54 high to $397.30 low. However, it once again faced sellers and struggled to break the $425 zone. There are also two key bearish trend lines forming with resistance around $420 on the hourly chart of ETH/USD. These trend lines are near the 38.2% Fib retracement level of the last decline from the $460.54 high to $397.30 low. Therefore, it won’t be easy for buyers to break the $420-425 resistance zone.
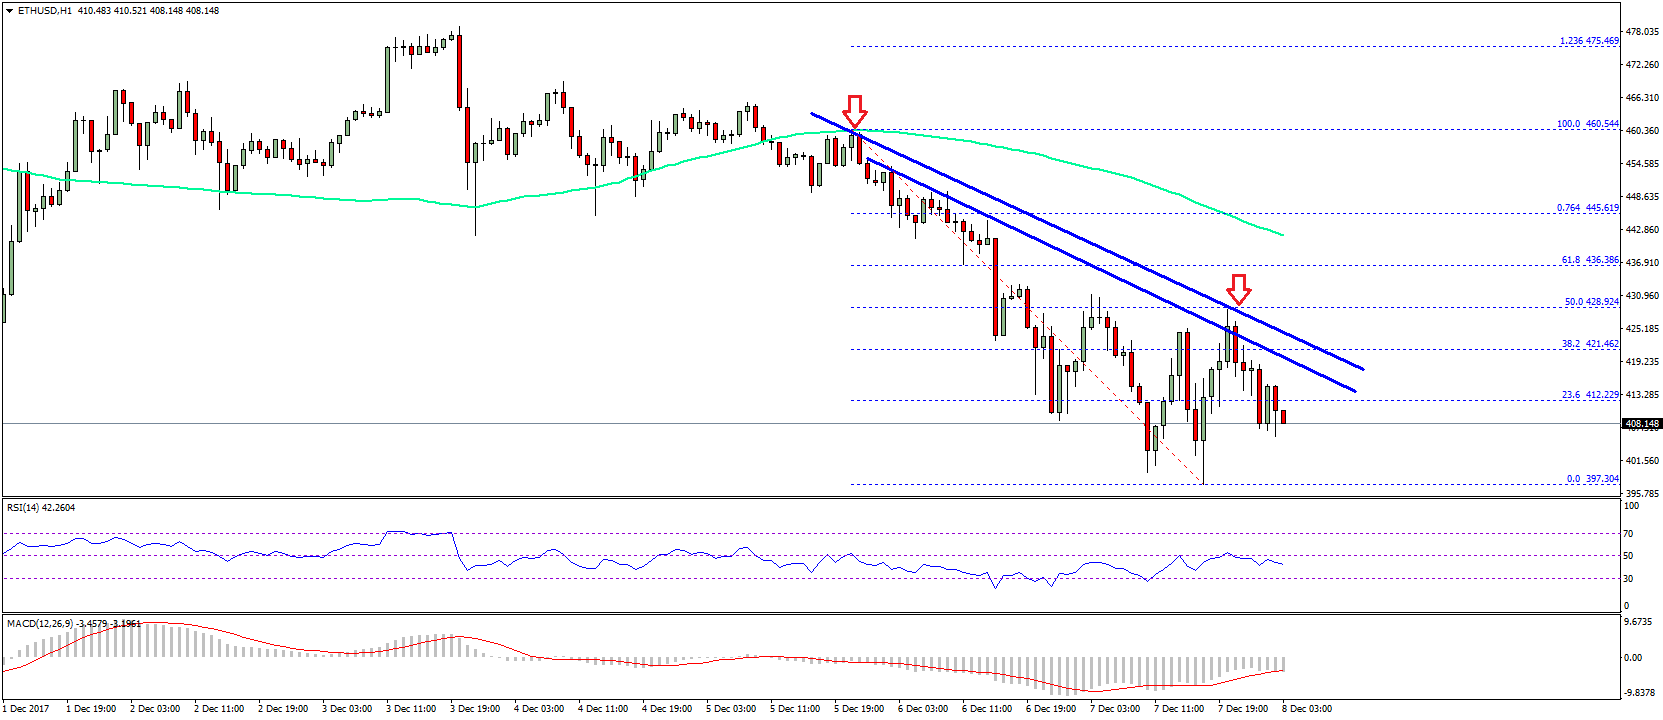
In short, it seems like the price is still in a downtrend below $425. It might retest the last swing low of $397 in the short term. Below $397, the price could accelerate decline towards the $380 support zone in the near term.
Hourly MACD – The MACD has slightly reduced its bearish slope.
Hourly RSI – The RSI is still below the 50 level and is struggling to move higher.
Major Support Level – $397
Major Resistance Level – $425
Charts courtesy – SimpleFX