Key Highlights
- ETH price failed once again to clear a major resistance area versus the US Dollar.
- This week we followed a bearish trend line on the hourly chart (data feed via SimpleFX) of ETH/USD, which is still in action and preventing gains.
- On the downside, there was a minor false break below the $11.45-50 support.
Ethereum price remained in a range pattern versus the US Dollar, but soon we should be able to see some swing moves in ETH/USD.
Ethereum Price Range
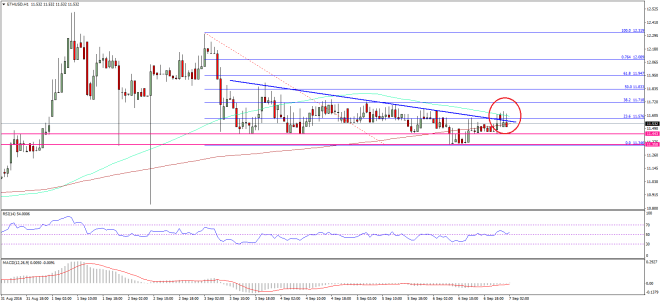
Ethereum price attempted once again to clear a major resistance area against the US Dollar, but the ETH bears managed to stay in action. We have been tracking a major bearish trend line on the hourly chart (data feed via SimpleFX) of ETH/USD this week. It once again acted as a crucial resistance and prevented an upside move in the pair. Furthermore, the 23.6% Fib retracement level of the last drop from the $12.30 high to $11.34 low also acted as a hurdle along with the trend line.
Last but not the least, the 100 hourly simple moving average is also around the trend line resistance. So, there is a monster resistance formed near $11.60. The ETH bulls need to clear it soon or sellers may step up the momentum and push the price down. A break and close may take the price towards the 50% Fib retracement level of the last drop from the $12.30 high to $11.34 low.

On the downside, the $11.50-40 support holds the key. I still believe as long as the price is above it, there is a chance of an upside move in the short term.
Hourly MACD – The MACD is attempting to move into the bullish zone, which is a positive sign.
Hourly RSI – The RSI is also above the 50 level, calling for more gains in ETH.
Major Support Level – $11.45
Major Resistance Level – $11.60
Charts courtesy – SimpleFX