Key Highlights
- The ETH price remained above the $340 and $335 support levels against the US Dollar.
- Yesterday’s highlighted contracting triangle pattern with support at $336 on the hourly chart of ETH/USD (data feed via SimpleFX) is still intact.
- The pair also succeeded in holding the 100 hourly simple moving average at $342.
Ethereum price is trading nicely against the US Dollar and Bitcoin, and it looks like ETH/USD is preparing for the next move above the $370 resistance.
Ethereum Price Support
Yesterday, we saw a range pattern above the $330-335 support in in ETH price against the US Dollar. The price remained in the stated range and above the $330 support. The best part was no break below the 100 hourly simple moving average at $342. The price moved nicely and traded with a neutral to bullish tone towards $350-360. There was once a dip below the 23.6% Fib retracement level of the last wave from the $256 low to $375 high. However, buyers were able to protect gains below $330.
There was no test of the 38.2% Fib retracement level of the last wave from the $256 low to $375 high. It looks like yesterday’s highlighted contracting triangle pattern with support at $336 on the hourly chart of ETH/USD is playing well. As long as the pair is above the 100 hourly simple moving average and $330 support, it may gain. On the upside, the triangle resistance is currently at $370. It is a contracting triangle, so the range of $335-370 will shrink as we move ahead.
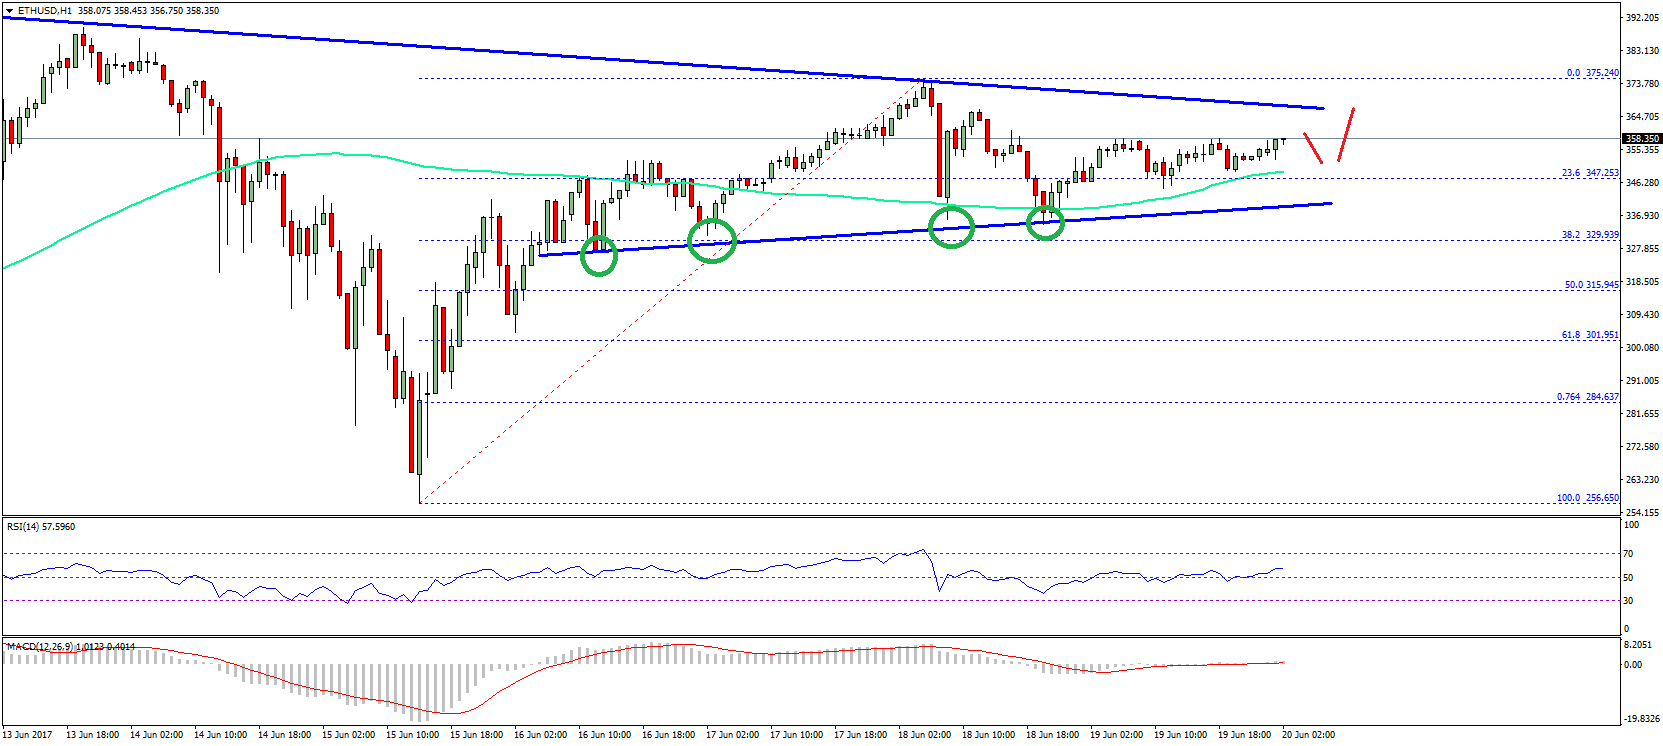
The price action is positive, and suggests a break above $370 soon. We need to carefully monitor the 100 hourly simple moving average and $330 in terms of support in the near term.
Hourly MACD – The MACD is almost flat.
Hourly RSI – The RSI is just above the 50 level, and showing positive signs.
Major Support Level – $330
Major Resistance Level – $370
Charts courtesy – SimpleFX