Key Highlights
- ETH price is struggling to move higher and is currently trading near the $290 level against the US Dollar.
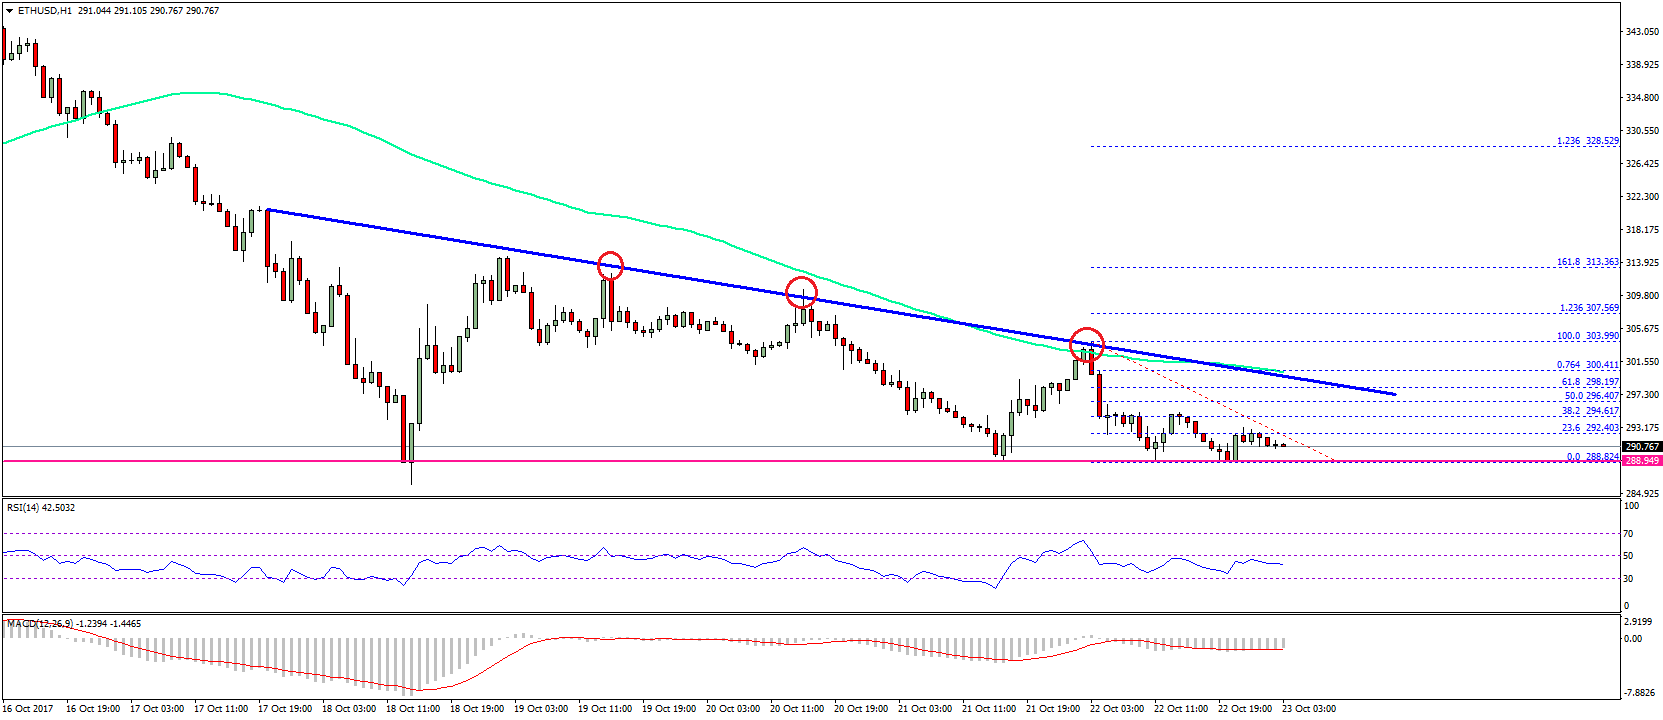
- There is a major bearish trend line forming with resistance near $298 on the hourly chart of ETH/USD (data feed via SimpleFX).
- The price might continue to struggle as long as there is no close above the $298-300 levels.
Ethereum price failed to gain traction against the US Dollar and Bitcoin. ETH/USD remains at risk of more losses if it does not move above $300 sooner or later.
Ethereum Price Resistance
There was a slow and steady decline in ETH price from the $307 swing high against the US Dollar. The price was not able to settle above $307 and the 100 hourly simple moving average. As a result, there was a downside reaction and the price settled below the $300 level. It is a bearish signs and puts the price at risk of more losses below $300. At present, the price is trading near the $290-288 support, but showing a lot of bearish signs.
On the upside, an initial resistance is around the 23.6% Fib retracement level of the last decline from the $303.99 high to $288.82 low. A recovery won’t be easy from the current levels, but the $288.50 support zone holds a lot of importance. To the topside, there is a major bearish trend line forming with resistance near $298 on the hourly chart of ETH/USD. Below the trend line, the 50% Fib retracement level of the last decline from the $303.99 high to $288.82 low is at $296.40.
In order to move back in the bullish zone, the price has to move above $298-300.
Hourly MACD – The MACD is still in the bearish zone with no major sign of a recovery.
Hourly RSI – The RSI is currently well below the 50 level.
Major Support Level – $288
Major Resistance Level – $300
Charts courtesy – SimpleFX