Key Highlights
- ETH price remains supported near $49.50 against the US Dollar, and currently moving higher.
- There is a nice bullish trend line with support at $50.05 formed on the hourly chart (ETH/USD, data feed via SimpleFX).
- On the upside, there is a connecting trend line with resistance at $51.
Ethereum price remains supported against the US Dollar above $49, and now ETH/USD looks for yet another break for the next move.
Ethereum Price Trend Line Support
It was a good session so far for ETH price, as it maintained bid tone above $50.10 against the US Dollar. The price traded higher from the $47.90 low and managed to move above the $50 handle. Earlier, there was a decline or we can say a correction was initiated from the $53.69 high. There was a 5-wave pattern (not a perfect one) with a break of the $50 handle. During the downside move, the price broke the 23.6% Fib retracement level of the last wave from the $42.15 low to $53.69 high.
It ignited further declines, and the price moved below $50. However, the 50% Fib retracement level of the last wave from the $42.15 low to $53.69 high acted as a support. It prevented further losses on two occasions near $47.90. The price finally moved higher and currently trading above the $50 handle. On the downside, there is a nice bullish trend line with support at $50.05 formed on the hourly chart (ETH/USD, data feed via SimpleFX). Similarly, on the upside, there is a resistance in the form of a connecting trend line $51.
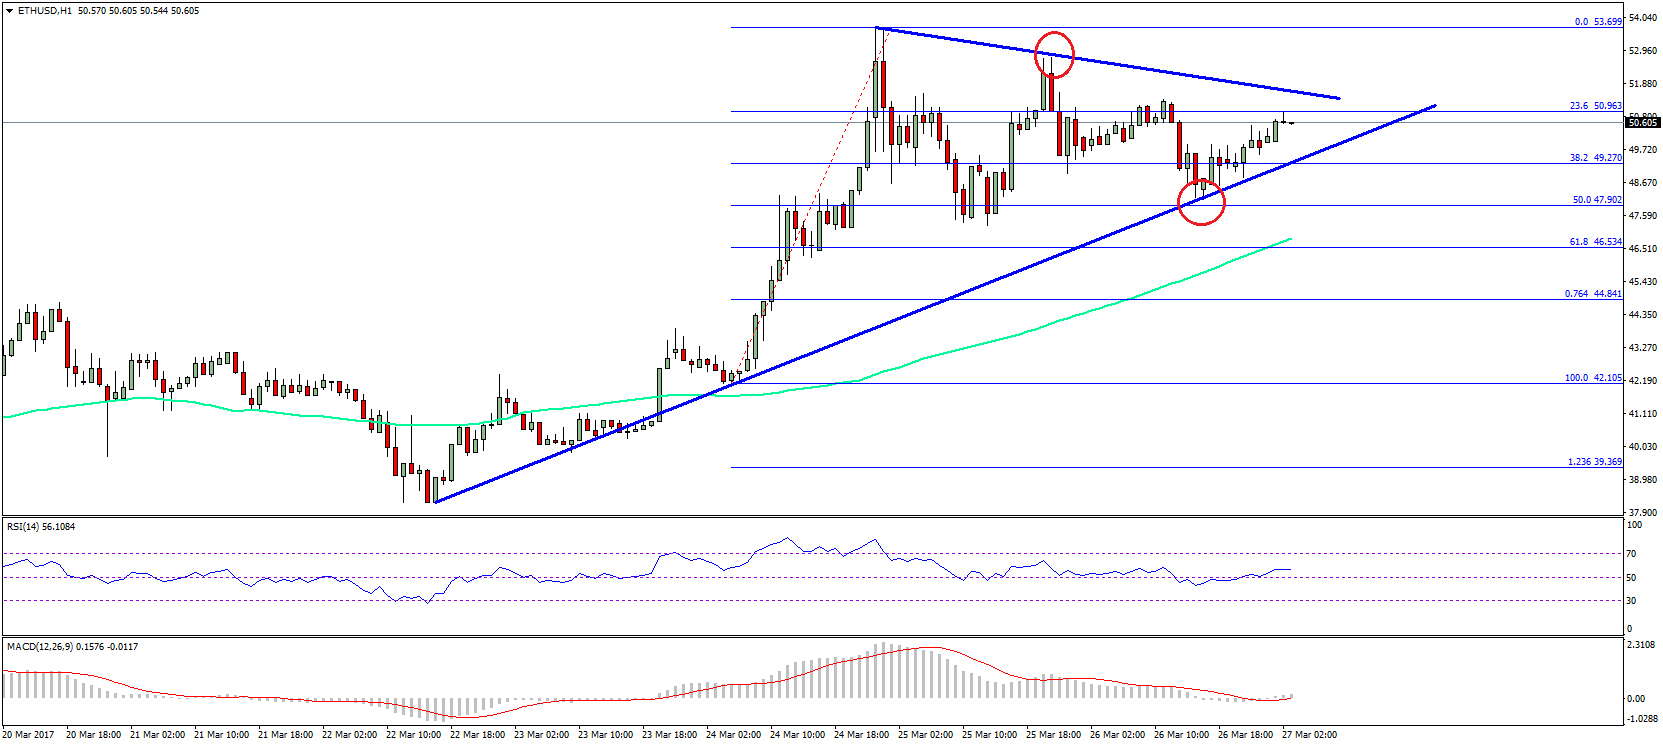
So, we can say that the price is above $50 support and below $51 resistance. It might soon approach a break with chances of a move towards $53 in the short term.
Hourly MACD – The MACD is again moving slightly in the bullish zone.
Hourly RSI – The RSI is just holding the 50 level.
Major Support Level – $50.00
Major Resistance Level – $51.00
Charts courtesy – SimpleFX