Key Highlights
- An increase in the bearish pressure ignited a downside break below $360 in ETH price against the US Dollar.
- There was a break below yesterday’s highlighted a cluster of bullish trend lines with supports at $360, $350 and $345 on the hourly chart of ETH/USD (data feed via SimpleFX).
- The pair just managed to hold the $310 support area and currently attempting a recovery.
Ethereum price failed to retain gains against the US Dollar and Bitcoin, and ETH/USD broke a major support area at $355-360 igniting downsides.
Ethereum Price Resistance
In yesterday’s analysis, we saw a connecting bearish trend line at $380 for ETH price against the US Dollar. The price failed to break the trend line resistance, and moved down below $370. The worst thing was a break below a major support area at $355-360. Moreover, there was a break below a cluster of bullish trend lines with supports at $360, $350 and $345 on the hourly chart of ETH/USD. The last break was below the 100 hourly simple moving average at $353.
These all are short-term bearish signs, and as it can be seen from the chart, the price fell and traded towards $300. However, buyers managed to hold the $310 support area. At the moment, the price is recovering, and trading above the 23.6% Fib retracement level of the last decline from the $389 high to $310 low. However, there is a major resistance forming at $355. The stated zone was a support earlier, and now it may prevent gains above $360.
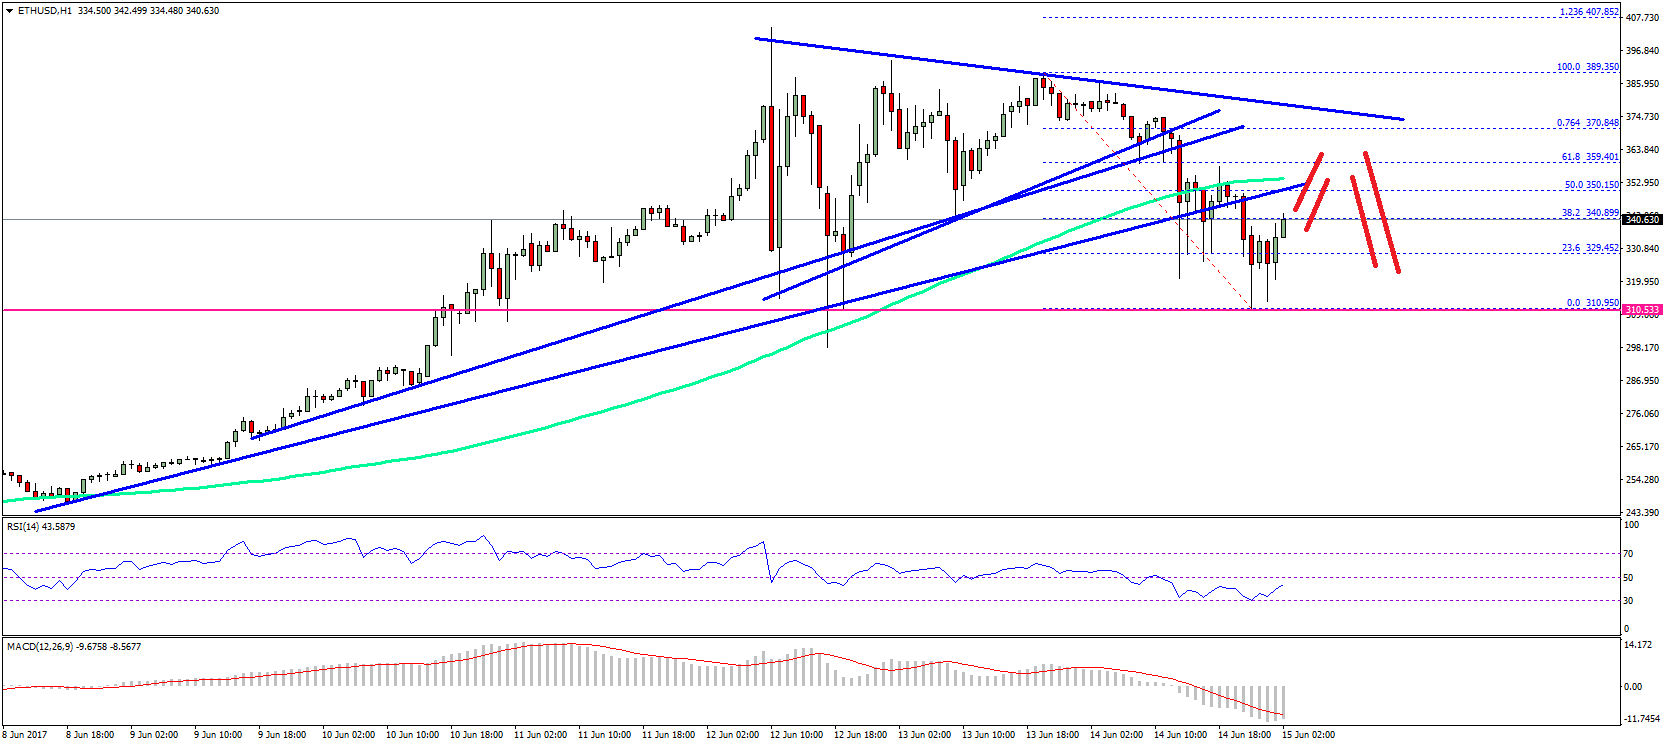
The 50% Fib retracement level of the last decline from the $389 high to $310 low is also at $350. Furthermore, the 100 hourly simple moving average at $353 is also waiting to act as a hurdle for buyers. Overall, there can be short-term swing moves in ETH towards $360-365 followed by downsides towards $340-330.
Hourly MACD – The MACD is now placed well in the bearish zone.
Hourly RSI – The RSI is slowly moving higher from the oversold readings.
Major Support Level – $310
Major Resistance Level – $360
Charts courtesy – SimpleFX
SaveSave
SaveSave