Key Highlights
- There was a sharp downside move in ETH price below the $188 support against the US Dollar.
- There were two bullish trend lines with support at $178 on the hourly chart (ETH/USD, data feed via SimpleFX), which were broken.
- The price traded towards $140 before starting a recovery above $150.
Ethereum price may have made a short-term top against the US Dollar and Bitcoin, as ETH/USD broke a key support area recently at $178.
Ethereum Price Decline
Yesterday, we were looking for a break above the $191.00-191.50 resistance in ETH price against the US Dollar. The price move above $191.00-191.50 and even broke the $200 level. A new high was formed at $203.45 where the price struggled. Later, ETH lost the bullish momentum, and started a downside move below $200. The price fell sharply and even broke the 50% Fib retracement level of the last wave from the $136.74 low to $203.45 high.
The downside move was such that there was a break of two bullish trend lines with support at $178 on the hourly chart of ETH/USD. The price even traded below the 100 hourly simple moving average at $169. It ignited a sharp decline, and the price moved as low as $139.39. Later, a recovery was initiated, and the price moved back above $150.
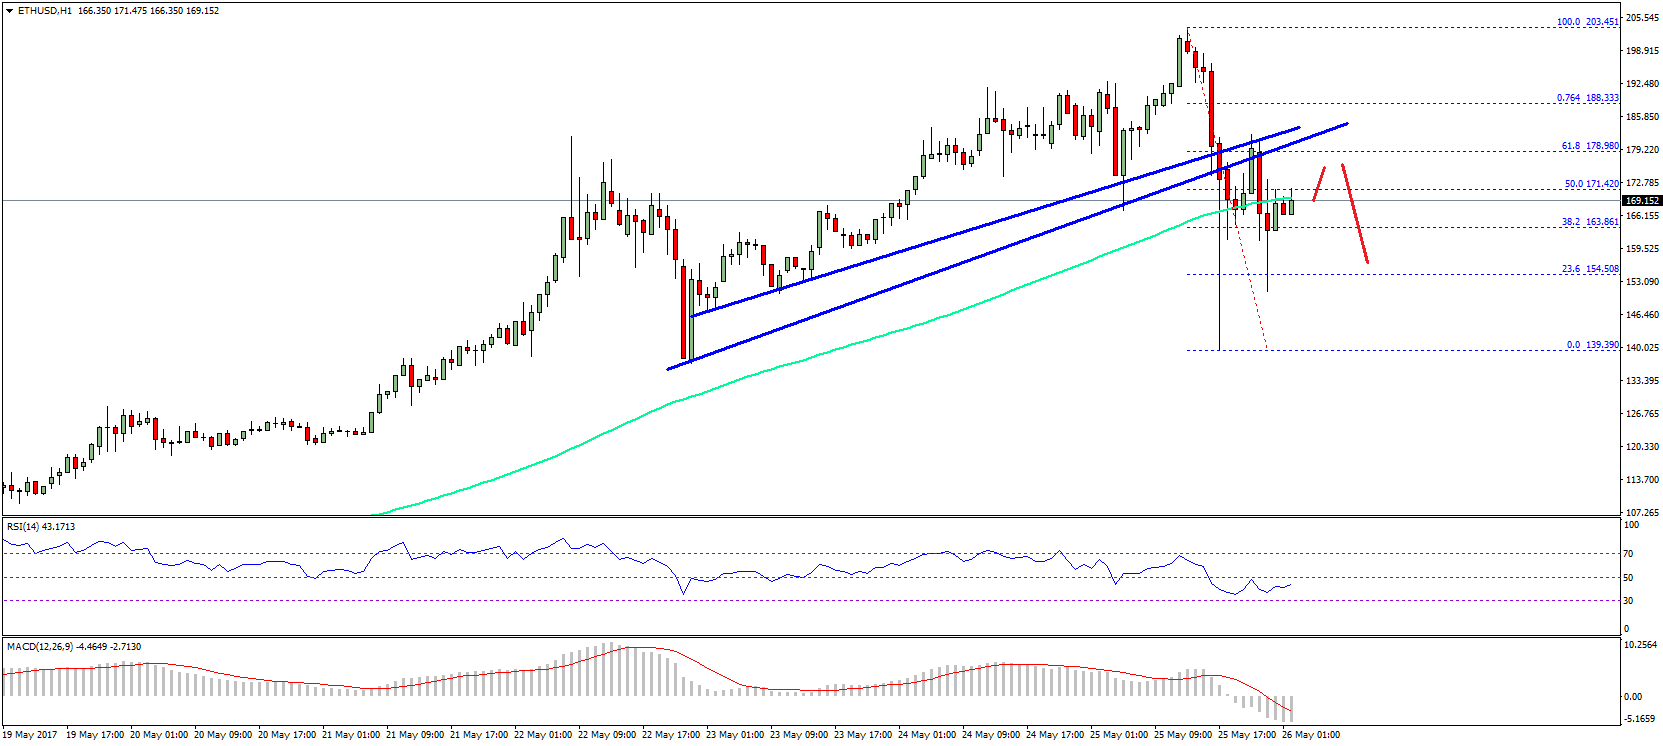
There was also a close above the 38.2% Fib retracement level of the last decline from the $203.45 high to $139.90 low. However, the recovery stalled near the broken trend lines at $178. Moreover, the 61.8% Fib retracement level of the last decline from the $203.45 high to $139.90 low acted as a resistance. The price is now back below the $170 support. It may once again attempt a break above $178, but very likely to face difficulties. It seems like there is a short-term trend change for ETH/USD with chances of another downside push towards $150.
Hourly MACD – The MACD is now back in the bearish zone.
Hourly RSI – The RSI is well below 50 level and struggling.
Major Support Level – $150.00
Major Resistance Level – $178.00
Charts courtesy – SimpleFX