Key Highlights
- ETH price started a minor correction against the US Dollar, but facing sellers near $7.75-80.
- There is a tiny bullish trend line formed on the hourly chart (data feed via SimpleFX) of ETH/USD, which is currently holding the downside.
- A break below the trend line support may call for more losses in the short term.
Ethereum price made an attempt to recover some ground against the USD and BTC, but faced a lot of hurdles on the upside.
Ethereum Price Resistance
There was a downside move in ETH price versus the US Dollar this past week, taking the price towards $7.34. Later, the price started a recovery, and managed to correct higher. There was a move above the 23.6% Fib retracement level of the last decline from the $8.33 high to $7.34 low. The ETH/USD pair traded towards the 100 hourly simple moving average, which acted as a resistance.
The ETH/USD pair was seen struggling to break the 100 hourly SMA, and formed a major resistance area at $7.75-80. The stated levels also coinciding with the 38.2% Fib retracement level of the last decline from the $8.33 high to $7.34 low. So, it holds a lot of value. There were many attempts to break the highlighted resistance area, but the ETH bulls failed to break it.
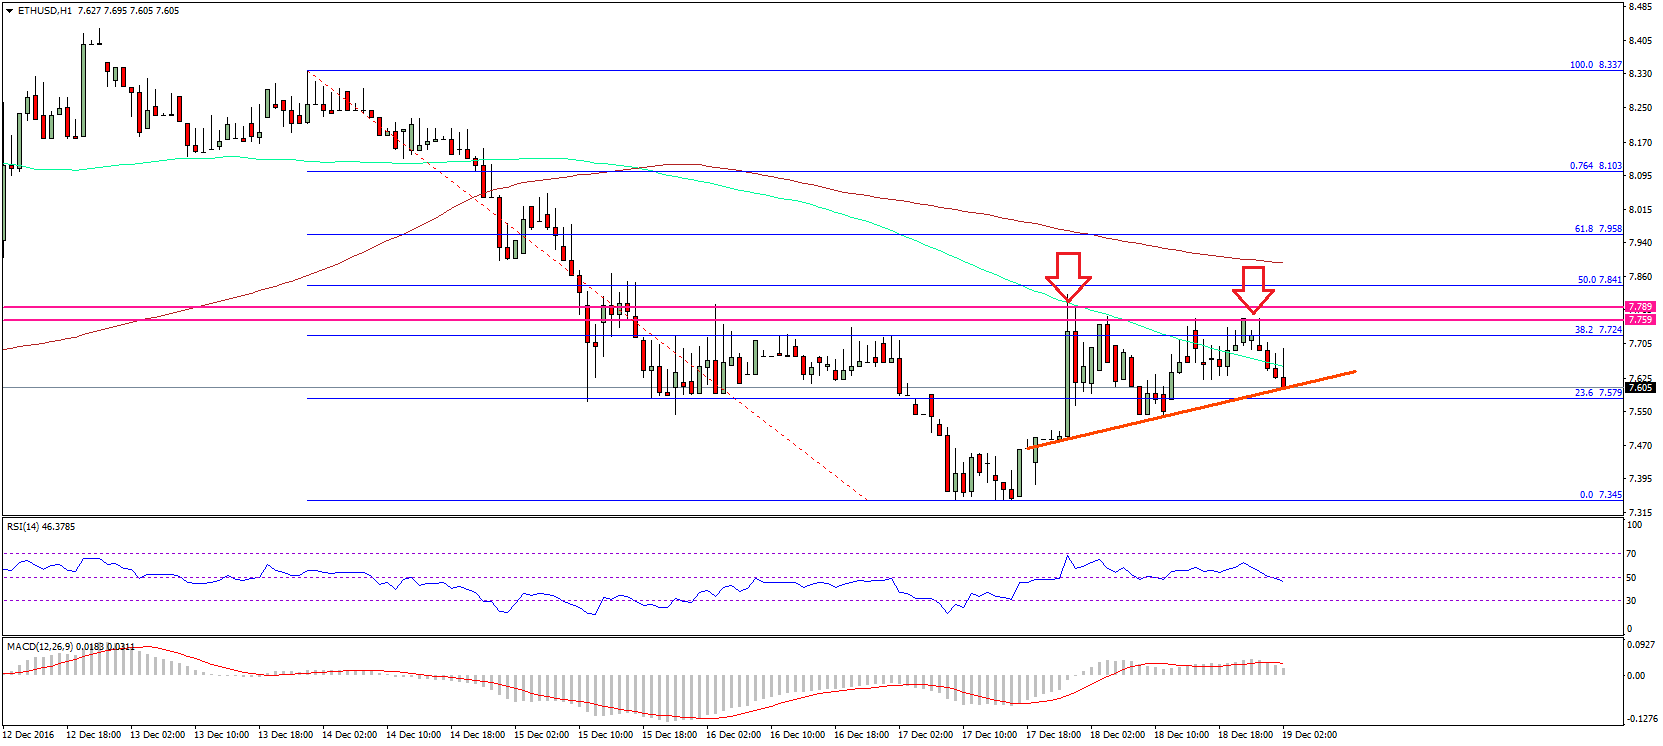
As a result, there was a downside move. The pair is currently trading lower, and finding support near a tiny bullish trend line formed on the hourly chart (data feed via SimpleFX) of ETH/USD. As long as the pair is above it, there can be a retest of $7.75. A break below it may be a sell call with a stop above the 100 hourly SMA.
Hourly MACD – The MACD is about to change the slope from the bullish to bearish zone.
Hourly RSI – The RSI is heading lower, and may break the 50 level soon.
Major Support Level – $7.50
Major Resistance Level – $7.80
Charts courtesy – SimpleFX