Key Highlights
- There were was a minor dip in ETH price towards $85 against the US Dollar, but later it recovered.
- There is a major connecting bearish trend line with resistance at $96.83 formed on the hourly chart (ETH/USD, data feed via SimpleFX).
- The price may dip once again, but likely to find support near the $92 level.
Ethereum price remained in the bullish zone against the US Dollar and Bitcoin, and ETH/USD is now once again preparing for the next move.
Ethereum Price Resistance
There were a few moves in ETH price as it dipped below the $90 level against the US Dollar. We can say that the price started a correction from the $100 swing high towards the $85.00 level. A low was formed near $84.60 from where a recovery was started. The price moved higher, and traded above the 23.6% Fib retracement level of the last decline from the $100.60 high to $84.60 low. There was a connecting bullish trend line at $85, which prevented further losses and pushed the price higher.
The price is now back above the 50% Fib retracement level of the last decline from the $100.60 high to $84.60 low. It may continue to trade higher. However, there is a major connecting bearish trend line with resistance at $96.80 formed on the hourly chart of ETH/USD. It may act as a hurdle and prevent gains above $96.
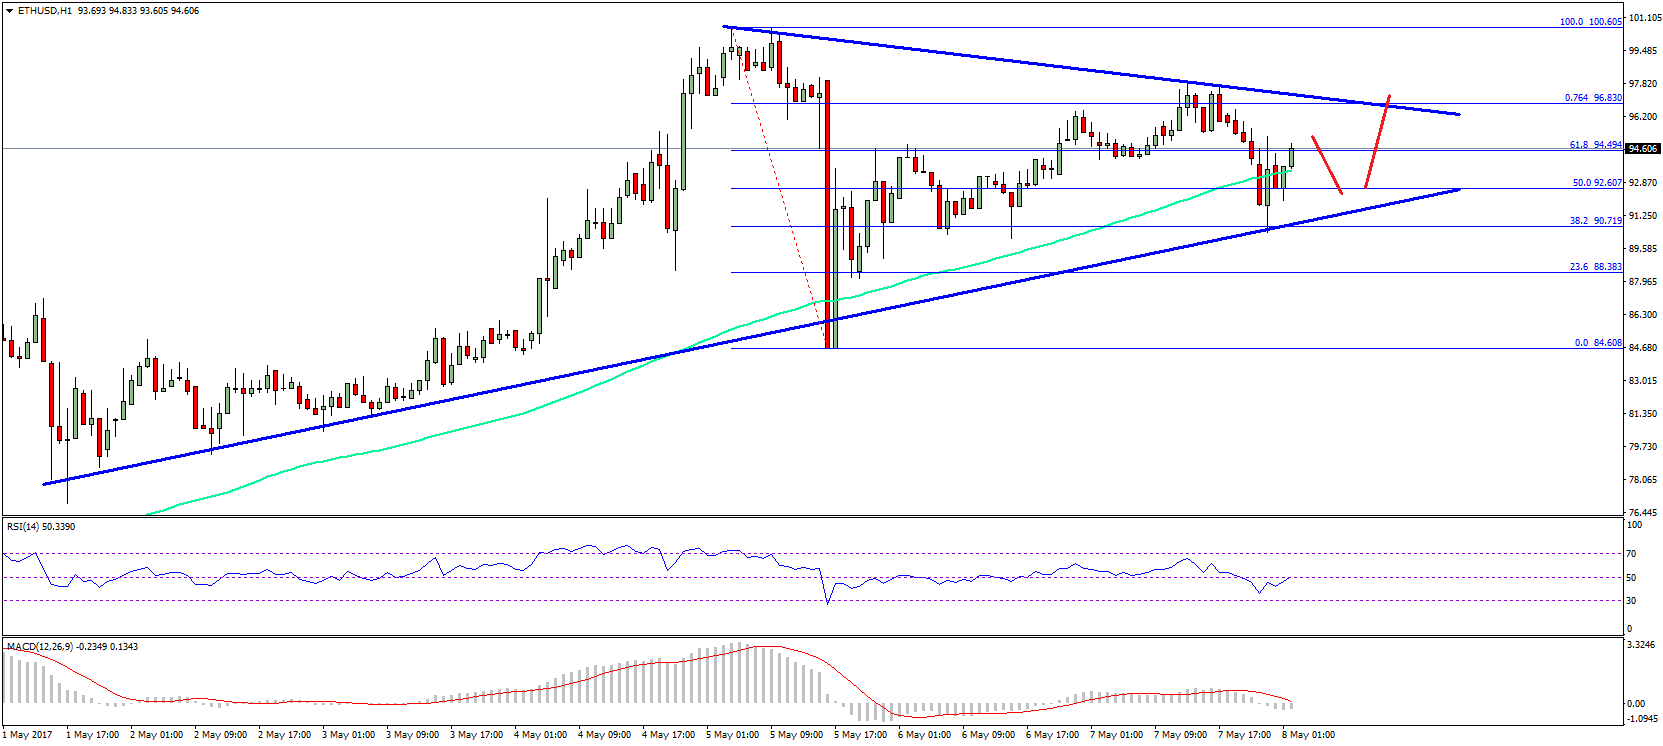
The same trend line also coincides with the 76.4% Fib retracement level of the last decline from the $100.60 high to $84.60 low. So, there can be a minor dip in ETH price before it makes another upside move above $96.
Hourly MACD – The MACD is just moving from the bearish to bullish zone.
Hourly RSI – The RSI is currently moving higher, and attempting to settle above the 50 level.
Major Support Level – $92
Major Resistance Level – $96
Charts courtesy – SimpleFX