Key Highlights
- There was a sharp decline in ETH price below $280 against the US Dollar before finding support at $256.
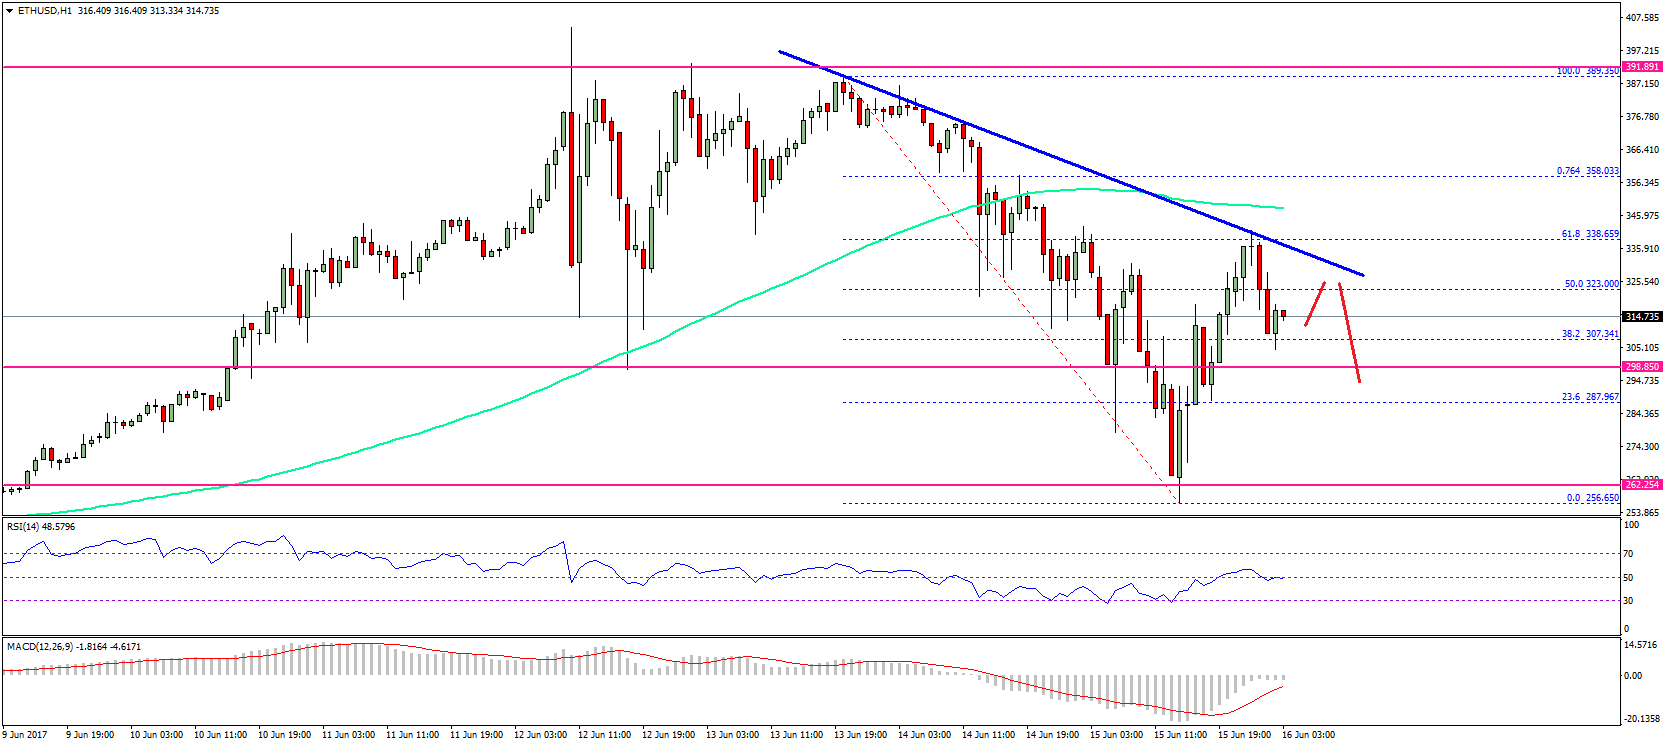
- There is a bearish trend line with resistance at $338 formed on the hourly chart of ETH/USD (data feed via SimpleFX).
- The pair may continue to correct lower as long as there is no close above the $350 level.
Ethereum price correction looks real against the US Dollar and Bitcoin, and ETH/USD may continue to move up and down towards $300 for some time.
Ethereum Price Support
In yesterday’s analysis, we saw a major decline in ETH price below $360 against the US Dollar. The price broke a cluster of bullish trend lines with supports at $360, $350, $325 and $310. The decline was such that the price even broke the $300 handle and traded towards $260. A new low was formed at $256 from where a recovery was started. The price moved above the 23.6% Fib retracement level of the last decline from the $389 high to $256 low.
However, the upside move remains capped by $335-340. There is a bearish trend line with resistance at $338 formed on the hourly chart of ETH/USD. It already failed to break the 61.8% Fib retracement level of the last decline from the $389 high to $256 low. Above the bearish trend line, the 100 hourly simple moving average at $350 is positioned. So, we can say there are many resistances on the way up near $$330 and $350. Any movement towards $340 may face selling pressure.
It looks like the price may continue to correct lower in 2-3 waves. On the downside, the $300 handle and then $360 support may play a major role in the near term.
Hourly MACD – The MACD is now flat and signaling correction pattern.
Hourly RSI – The RSI is moving just near the 50 level.
Major Support Level – $260
Major Resistance Level – $340
Charts courtesy – SimpleFX