Key Highlights
- ETH price slowly recovered towards $320 against the US Dollar, but any major recovery seems very unlikely.
- There is a new short-term contracting triangle pattern with resistance at $320 forming n the hourly chart of ETH/USD (data feed via SimpleFX).
- There is a chance of another downside push towards the $300 handle as long as there is no close above $330.
Ethereum price is under heavy downside pressure against the US Dollar and Bitcoin, and there is a chance of ETH/USD retesting $300 in the near-term.
Ethereum Price Under Pressure
A correction wave was initiated from the $288 swing low in ETH price against the US Dollar. The recent decline is worrying since there was a break below the $300 handle as well. However, it’s hard to call the recent decline as a major setback. A pullback was initiated from the $288 low and moved above $300. There was a break above the 23.6% Fib retracement level of the last decline from the $365 high to $288 low.
The upside move was prevented near the $326-328 resistance, which is acting as a hurdle for buyers. It also represents the 50% Fib retracement level of the last decline from the $365 high to $288 low. There is a new short-term contracting triangle pattern with resistance at $320 forming n the hourly chart of ETH/USD. The highlighted contracting triangle pattern may ignite the next move either above $326 or below $316. There are chances of a downside push if buyers fail to break $330 in the near-term.
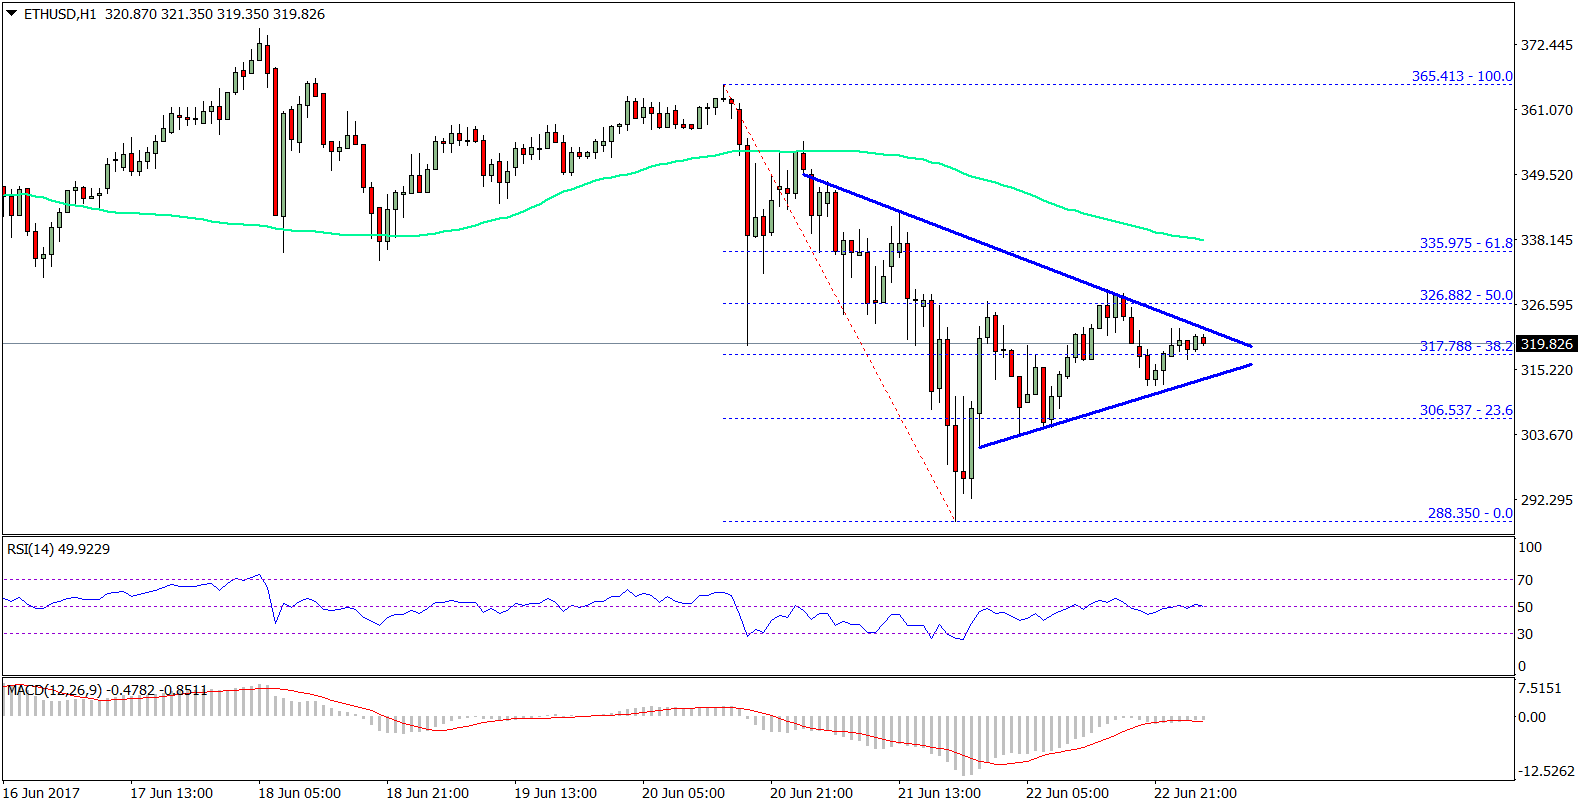
On the downside, an immediate support is at $310 followed by $300. On the other hand, a break above $330 might call for a test of the 100 SMA at $336, which is the next resistance.
Hourly MACD – The MACD is currently flat and suggesting consolidation.
Hourly RSI – The RSI is attempting to climb and settle above the 50 level.
Major Support Level – $310
Major Resistance Level – $330
Charts courtesy – SimpleFX