Key Highlights
- ETH price failed once again to overtake $12.70 against the US Dollar, and started moving lower.
- Yesterday’s highlighted bullish trend line with support at $12.58 was broken on the hourly chart of ETH/USD (data feed via SimpleFX).
- The pair is now below the 100 hourly simple moving average with resistance on the upside at $12.57.
Ethereum price moved down once again against the US Dollar, and it looks like the ETH/USD pair might accelerate the downside towards $12.40.
Ethereum Price Trend Line Resistance
There were continuous offers near $12.65-12.70 in ETH price against the US Dollar. As a result, the price moved down, and broke the $12.60 support area. There was also a break below the 100 hourly simple moving average at $12.60. Moreover, yesterday’s highlighted bullish trend line was broken at $12.58 on the hourly chart of ETH/USD (data feed via SimpleFX).
Lastly, the price also broke the 23.6% Fib retracement level of the last wave from the $12.07 low to $12.73 high. These all are signs that the price may continue to move down. On the upside, there is a bearish trend line with resistance at $12.57. Most importantly, the 100 hourly simple moving average is around the same trend line at $12.57. So, overall, there is a major resistance formed near $12.60, which can also be seen as a sell area.
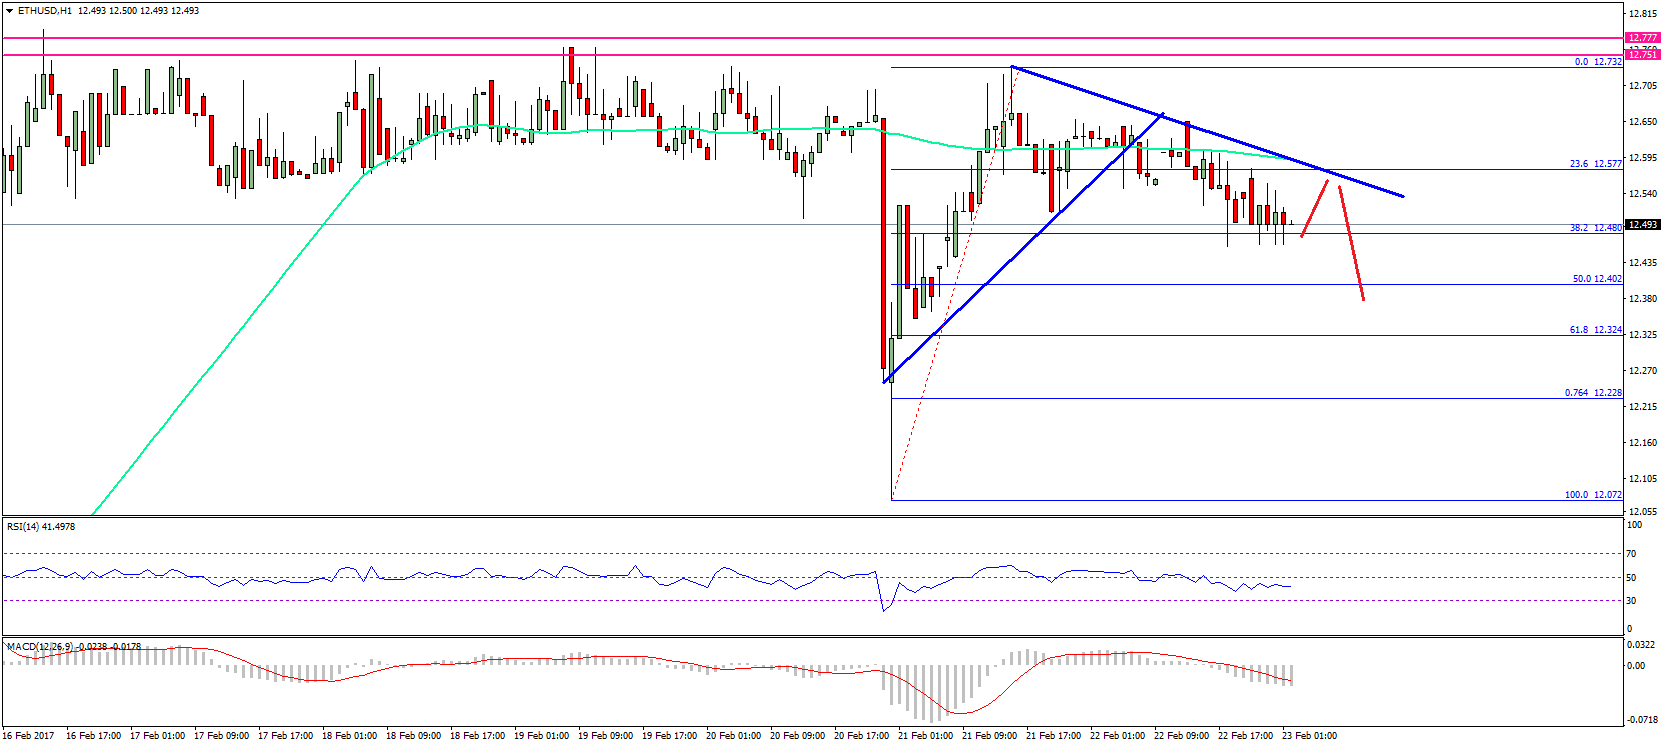
On the downside, the 38.2% Fib retracement level of the last wave from the $12.07 low to $12.73 high is acting as a support at the moment. A break below it could open the doors for a test of the $12.40 area. Any further declines could even take the price towards $12.32, which is the 61.8% Fib level of the same wave.
Hourly MACD – The MACD has moved in the bearish zone, suggesting bearish signs.
Hourly RSI – The RSI is also below the 50 level.
Major Support Level – $12.40
Major Resistance Level – $12.60
Charts courtesy – SimpleFX