Key Highlights
- After a move towards $375, ETH price started correcting lower against the US Dollar.
- There is a connecting bearish trend line with resistance at $370 formed on the hourly chart of ETH/USD (data feed via SimpleFX).
- The pair is holding an important support at $335 and the 100 hourly simple moving average.
Ethereum price is holding key supports against the US Dollar and Bitcoin, and ETH/USD may trade in a range above $335 for some time before the next move.
Ethereum Price Range
We witnessed a decent recovery from the $256.65 low in ETH price against the US Dollar. The price moved higher above the $340 and $350 resistance levels and recently traded close to the $375 level. It faced sellers near $375 and started a correction. Actually, a connecting bearish trend line with resistance at $370 on the hourly chart of ETH/USD acted as a hurdle. It pushed the price below the 23.6% Fib retracement level of the last wave from the $256 low to $375 high.
At the moment, the price is holding a major support at $335 and the 100 hourly simple moving average. There is also a short-term bullish trend line just around $335. So, it looks like the $335 support and the 100 hourly SMA may act as a crucial pivot for ETH. As long as the price is above $335, there can be a retest of the trend line resistance at $370.
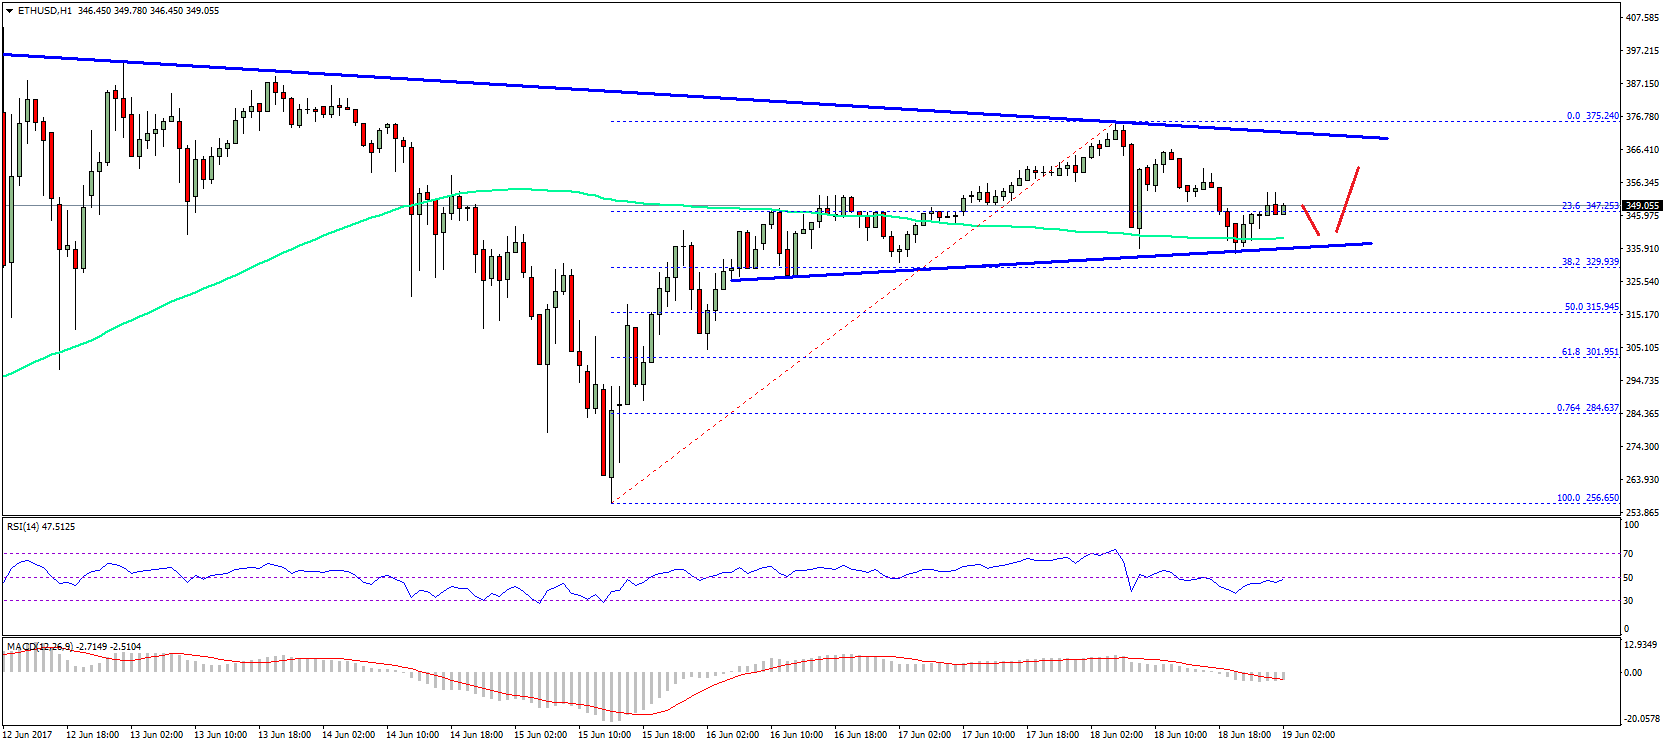
On the other hand, a break below $335 could take the price towards the 50% Fib retracement level of the last wave from the $256 low to $375 high at $315. The overall picture suggests a range pattern for ETH/USD above $330-335 until the next move.
Hourly MACD – The MACD is attempting to move back in the bullish zone.
Hourly RSI – The RSI is just below the 50 level and heading higher.
Major Support Level – $335
Major Resistance Level – $370
Charts courtesy – SimpleFX
SaveSave